The figures do not unequivocally show that children are driven to school more and more often. As shown in Table 1, the number of children driven to school did not change much in the years 2003-2014, with the exception of a peak in the study by Metz & De Haan [24]. The latest study was done by XTNT in 2014 among 1,847 households (2,739 children) [25]. This study shows that 12% of the children are always taken to school by car. When looking at the average cycling distance in kilometres per child per day for children aged 0-12, there have not been any large differences in the last eight years (Figure 4).
|
Study |
Independently |
|
Accompanied |
|
Other |
|||
|
|
On foot |
By bike |
|
On foot |
By bike |
By car |
|
|
|
Van der Houwen, Goossen & Veling (2003) [26] |
15% |
21% |
|
18% |
28% |
15% |
|
3% |
|
Hoekstra, Mesken & Vlakveld (2010) [27] |
15% |
20% |
|
16% |
27% |
12% |
|
10% |
|
Hoekstra & Mesken (2010) [28] |
12% |
20% |
|
23% |
25% |
15% |
|
5% |
|
Metz & De Haan (2013) [24] |
14% |
17% |
|
16% |
20% |
30% |
|
3% |
|
XTNT (2014)* [25] |
8% |
16% |
|
13% |
22% |
12% |
|
1% |
Table 1. Percentages of children that travel to school independently or are accompanied to school
*the percentage of children that always travel to school in this way (ranging from never or sometimes to always).
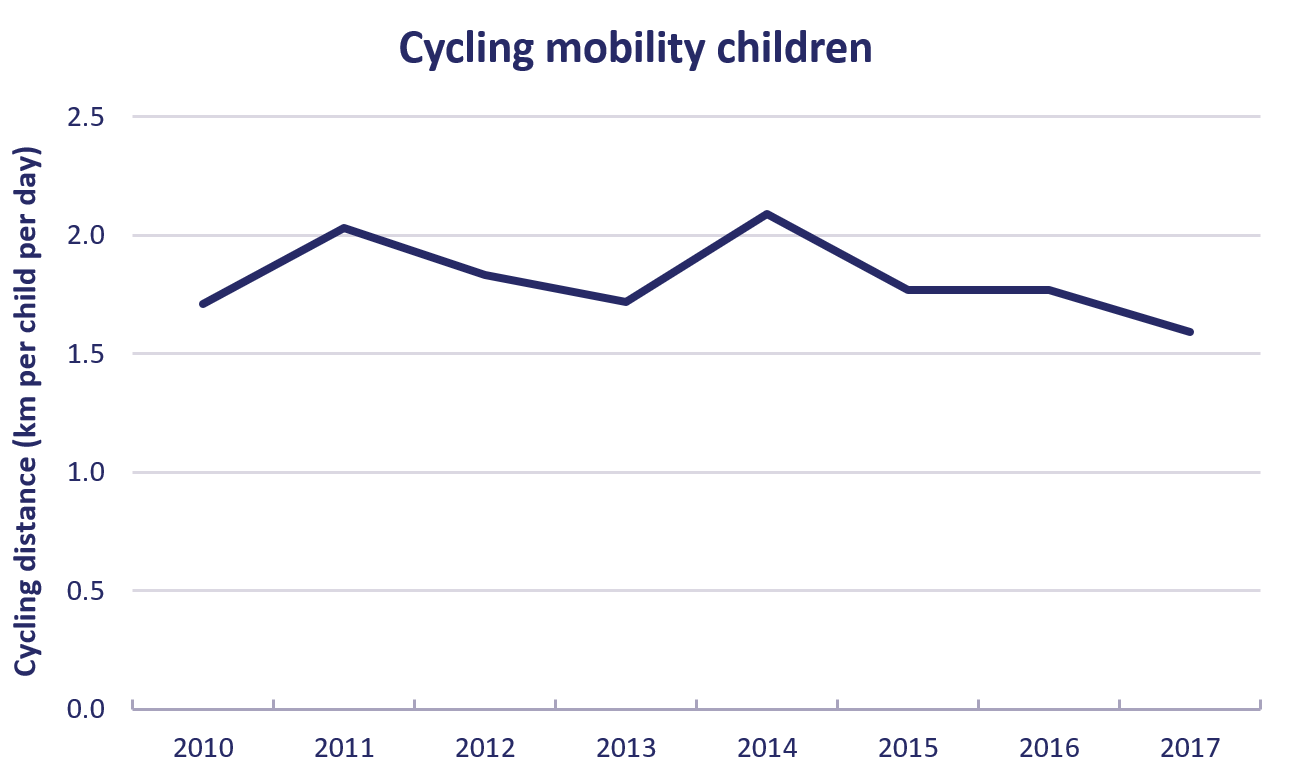 Figure 4. The number of bicycle kilometres per day, per child, for children aged 0-12. Source: CBS StatLine, 2018.