Traffic enforcement

Updated

In the Netherlands, a sustainable road safety approach, in which measures in the fields of Engineering, Education and Enforcement (3Es) are complementary, has been used for decades. Enforcement reduces high-risk road user behaviour and is therefore an important component of this safe system approach. The objective probability of detection (the actual chance of being caught when committing an offence) and the subjective probability of detection (the assumed chance of being caught derived from the road user’s personal judgement) largely determine the success of traffic enforcement. Penalty severity only affects road user behaviour to a modest extent.

The general Frontline Teams, the Traffic Teams of the Regional Units, and the Central Unit (Previously: the National Police Services Agency (NPSA)) supervise traffic. This involves close cooperation within the local triangle (mayor, Public Prosecution Service and police), and cooperation with road authorities and partners such as the Dutch Traffic Safety Association. Since 2016, the following national enforcement priorities have applied: Repeat Traffic Offenders, Distraction, Red light negation, Alcohol and drugs, and Speed (Dutch abbreviation: VARAS). The number of fines generated through camera surveillance has remained stable for the last ten years. The number of fines after a police stop, however, has considerably decreased from an annual million in 2008-2010 to slightly more than 400,000 in 2018.

Information about demerit points and progressive fines systems can be found in SWOV fact sheet Progressive penalty systems in traffic.

How is traffic enforcement organised in the Netherlands?

Since 2013, the Dutch national police force has consisted of ten Regional Units – divided into 43 districts and 168 Frontline Teams – and a Central Unit (previously NPSA). Traffic rules are enforced by the general Frontline Teams and the Traffic Teams of the Regional Units, which are part of the Regional Operational Cooperation Service – department of Infrastructure. The Frontline Teams offer basic police services (street patrols, advice on prevention, supervision of the catering industry, public assistance, basic investigative activities, enforcement of arms and ammunition regulations and legislation, opening hours of shops, and licensing hours). Since the police reorganisation, the Regional Units, together with the Central Unit, have also been responsible for traffic enforcement on motorways.

When the National Police Force was created, the Traffic Enforcement Teams became incorporated into Traffic Teams. These teams are involved in different traffic tasks, among which general traffic enforcement compliant with the priorities (Repeat Traffic Offenders, Distraction, Red light negation, Alcohol and drugs, and Speed), enforcement of ‘special road traffic acts’ (taxi issues, exceptional transport, rest and driving times), processing and investigation of motorway incidents, and traffic engineering advice [1]. According to the 2012 National Police Development Plan [1] the size of the Frontline Teams may range from 60 to 200 FTEs. A study by Terpstra et al. [2] showed the spread among the studied Frontline Teams to be smaller: from 130 to 176 FTEs, with an average of 151. No figures are available about the size of the Regional Unit’s Traffic Teams.

The deployment of Frontline Teams for traffic enforcement is determined by triangle agreements (mayor, Public Prosecution Service and police), the integral safety plans of local councils, and the national priorities of the Safety Agenda 2019 -2022 [3]. This agenda does, however, not mention road safety. The deployment of the Regional Unit’s Traffic Teams is determined on the basis of (regional) enforcement plans. On motorways, the Central Unit’s Electronic Surveillance Service enforces speed, in addition to enforcement by section control systems (average speed checks). This service monitors speed by radar checks for high-risk sections of motorways on the basis of risk and driving speed data [4]. In addition, the Public Prosecution Service has set an annual target of 35,000 police stops for Central Unit officers [4].

In the future, special investigating officers (Dutch abbreviation: BOAs) may also be entrusted with traffic enforcement powers. At the moment (in 2019) BOAs cannot issue fines for traffic violations. The Association of Netherlands Municipalities is in favour of the new powers [5] [6] to compensate for the limited police capacity for traffic enforcement (also see the question What is the traffic enforcement capacity in the Netherlands? ).

What are the national traffic enforcement priorities?

In 2016, the Public Prosecution Service defined the following national traffic enforcement priorities [7]:

To meet these priorities, the Public Prosecution Service has presented the following guidelines [7]:

  • Police will continue to use 659 FTEs for the sole purpose of traffic enforcement. This has been stipulated by the Public Prosecution Service when transferring the budget for the traffic enforcement teams.
  • Being stopped will imply a breath test. Apart from the usual alcohol checks, drivers will have to take a breath test whenever they are stopped by the police, in order to increase the subjective probability of detection.
  • Being stopped will imply a driver’s licence check. This will increase the subjective and objective probability of detection for road users whose licence has been suspended.
  • Helmet and seat belt checks during surveillance. Helmet and seat belt compliance has been around 97% for years. Therefore, checking for this compliance is no longer designated a priority, but it has been agreed to include it in other police checks.
Which traffic enforcement methods do police use?

In traffic enforcement, first of all two types of methods can be distinguished: enforcement by means of stopping drivers or by means of camera surveillance on the basis of licence plates. The method also depends on the type of violation. Table 1 presents an overview of the most common methods used for different types of violations, whether by stopping drivers or by licence plate recognition.

Violation type

Police stops

Licence plate recognition

Alcohol and drugs

Breath test, drug test and, possibly, breath analysis

-

Distraction

Surveillance by vehicle

In test phase: smart cameras to detect use of handheld smart phones

Speed (point measurement)

Laser gun

Fixed camera (speed camera), mobile radar

Speed (over a road section)

Video vehicle

Road section control

Construction speed (moped/light moped)

Roller test bench

-

Red light negation

Surveillance by car or discreet surveillance

Fixed camera (red light camera)

Repeat traffic offenders

Surveillance by vehicle (often by police motorcyclist or video car)

-

Table 1. Overview of the most common traffic enforcement methods in the Netherlands.

What is the traffic enforcement capacity in the Netherlands?

In the Netherlands, 659 FTEs are annually deployed for police traffic enforcement. Traffic enforcement is done by camera surveillance and by means of police stops. Surveillance is partly automated by means of fixed or mobile cameras. In case of a police stop, the offender is stopped and held to account for the violation. Offenders may either be warned or fined and always have to identify themselves.

For the purpose of camera surveillance, 640 cameras were used in 2018, to determine speed violations, red light negation or driving over crossed out lanes. In addition, 11 road section control systems were used to determine speed violations. The system locations are to be found on www.om.nl/onderwerpen/verkeer/handhaving-verkeer/snelheid/trajectcontrole/. The road section control systems used to be exclusively located on motorways. But in 2019 and 2020, twenty road section control systems will be installed on high-risk provincial roads in order to increase road safety on these roads. According to figures of the Central Fine Collection Agency CJIB), the fines generated by camera surveillance have amounted to a steady 9 million since 2010. Only in 2014 and 2015, the malfunctioning of a few road section control systems caused a slight and temporary decrease [8] [9].

The number of fines after a police stop has, however, considerably decreased from well over an annual million in 2008-2010 to fewer than 360,000 in 2016. This number slightly increased to 385,000 in 2017 and 404,000 in 2018. There are various reasons for the substantial decrease in 2008-2016. According to the Interdepartmental Policy Research task force [10], the main reasons were the abolition of the fines quota, altered prioritisations within the police organisation and the economic crisis. According to Goldenbeld and Houwing [11], the decrease may also have been caused by less priority for road safety at a local level, and by CLA actions of the police unions in 2015. It is also notable that the number of large-scale alcohol checks almost halved, from over 6,000 in 2013 to slightly fewer than 3,100 in 2016 (see [12]).

In other countries, the number of police stops for traffic violations also seems to decrease. The European Transport Safety Council ETSC, an independent road safety advisory body of the European Commission, of the European Parliament and EU member states, is concerned about this development which results in a significantly lower chance of apprehension for traffic rule violations (other than speed and red light negation) [13].

Which are the sanction types for traffic violations?

In the Netherlands, there are three kinds of sanctions for traffic violations: administrative sanctions imposed by the Central Fine Collection Agency CJIB, punitive sanctions, and administrative sanctions imposed by the Driving Test Organisation CBR. Sometimes, a combination of sanctions is applied, particularly concerning alcohol violations. CJIB publishes an annual Collection of crimes, offences and minor misdemeanors, which contains guidelines for financial sanctions, administrative sanction offences and traffic violations [14]. In addition, the Penal Code contains special penalties for serious traffic crimes carrying a conviction for murder or manslaughter, (aggravated) assault, or attempts at manslaughter or aggravated assault [15].

Administrative CIJB sanctions

The Administrative Traffic Enforcement Act (Dutch abbreviation: WAHV) imposes standard fines for minor traffic violations, such as illegal parking or minor speeding offences. The WAHV is also known as the ‘Mulder Act’ and the fines as ‘Mulder fines’. If the traffic violation has been detected by camera, the vehicle owner is identified by licence plate and is sent a fine. The owner is not always identical to the driver committing the violation. In case of a police stop, however, the offenders themselves will incur the fine. The Central Fine Collection Agency CJIB, an executive agency of the Ministry of Justice and Security, processes the WAHV violations. If a traffic violation is not covered by the WAHV, the public prosecutor decides whether the offender will receive a punitive order or a settlement proposal, or whether the offender will be summoned to court.

Punitive sanctions

Punitive sanctions are imposed in case of serious traffic violations as dictated by the 1994 Road Traffic Act. Violations include drink driving, ignoring a driving ban and leaving the scene of a crash. The Public Prosecution Service or the court imposes punitive sanctions. Sanctions may comprise fines, driving licence suspension, community service, or a combination of these three.

Administrative CBR sanctions

If road users engage in drink or drug driving or in dangerous driving, police may report this to the Driving
Test Organisation CBR. CBR may then evaluate the offender’s fitness to drive (the so-called disqualification procedure) or oblige the offender to take a course (e.g. Light Educational Measure Alcohol – LEMA, or Educational Measure Alcohol  – EMA; also see the question What are rehabilitation courses and how effective are they? ). Up until 2015, CBR was allowed to impose an alcohol lock; also see SWOV fact sheet Driving under the influence of alcohol. Road users are obliged to comply with administrative CBR sanctions to be able to keep their driving licences.

Combination of sanctions/measures

In the Netherlands, different types of sanctions may be imposed simultaneously. If a road user is apprehended for a second instance of drink driving, he may be faced with three parallel procedures:

  1. Criminal court proceedings.
  2. Evaluation of fitness to drive. With a substantial alcohol level or a three-time apprehension, Driving
    Test Organisation CBR may decide to evaluate the offender’s fitness to drive on account of alcohol use.
  3. Alcohol recidivism regulation. When a motor vehicle driver is convicted of drink driving twice within five years, with the second instance measuring a 1.3 promille minimum, the offender’s driving licence will be revoked.

Also see the archived SWOV fact sheet Penalties in traffic.

What does traffic enforcement effectiveness depend on?

Police traffic enforcement works on the basis of the objective and subjective probability of detection, and the subsequent sanctions or measures. Police surveillance along the road determines the objective probability of detection or the enforcement pressure [16]. Road users assess the chance of being caught for a violation on the basis of this enforcement pressure and also on what they read in newspapers or hear from friends and acquaintances: this is the subjective probability of detection. When this probability is deemed to be sufficiently high, violations will be avoided.

In order to ensure that the subjective probability of detection is sufficiently high, it is important to have regular police checks that are unpredictable, highly visible, hard to evade, and accompanied by significant publicity. If the subjective probability of detection is sufficiently high, the preventive effect of police surveillance is generally larger as the certainty of punishment is greater, as the punishment follows the violation more rapidly, and as there is more public support for enforcement [16]. Each of these elements are links in the traffic enforcement chain.

Penalty severity only affects the preventive effect of enforcement to a limited extent. Research has shown that it is less likely to affect road user behaviour than the probability of detection is. Moreover, higher penalties will not affect drink driving, probably because the current penalties are already rather severe. Minor offences, such as speeding, not wearing a seat belt, and red light negation, do decrease somewhat as penalties are higher, but only on those roads that are frequently policed [17] (also see the question Do higher penalties work?).

Apart from a preventive instrument, police enforcement is also a selection instrument. By revoking a driving licence and by disqualifying drivers, dangerous drivers may be excluded from traffic (selection), which will enhance road safety. Repeat offenders are only a small proportion of the entire population (less than 0.5 %), yet, as drivers, they are involved in 6 % of the crashes [18] [19].

Do higher penalties work?

Higher penalties do not affect drink driving, probably because the current penalties are already rather severe. Higher penalties do affect some violations however, such as speeding, non-usage of seatbelts and red light negation, but only on those roads that are frequently policed [17].

Drink driving

Higher penalties for drink driving are not effective. In the Netherlands, in 1992, penalties for drink driving became substantially higher (higher fines and a speedier licence suspension), but this did not lead to a decrease of drink driving [20]. Instead, drink driving increased somewhat, probably also because the enforcement level was strongly reduced. International studies do not show any effect either. Several American state laws imposing imprisonment for first-time drink-driving offenders did not appear to have any effect, or only a slight effect, on the prevalence of drink driving [21]. In Australian New South Wales, doubling the penalty for drink driving (in 1998) was not associated with a reduction of drink driving, nor with the number of crashes [22]. Nor did a different Australian study find any relation between penalty severity and the chance of an offender having to re-appear in court for drink driving [23].

Why penalty severity does not affect drink driving may be explained in several ways. Firstly, a lot of people who participate in traffic having consumed too much alcohol are alcohol-dependent. It is very hard for them to reduce their alcohol consumption, which increases the chance that they will persist in their offensive behaviour. Secondly, the chance of apprehension experienced by the offenders is too small. If offenders are caught for the first time, they will not immediately conclude that the chances of apprehension are significant. After all, years of undiscovered drink driving have often preceded the apprehension. Finally, it is possible that persistent drink drivers are sensitive to the so-called ‘gambler’s fallacy’, for which Pogarsky and Piquero [24] have found proof. Drink drivers who have gone undetected for years, wrongly assume that their chances of being caught have diminished after their first apprehension and penalty. For them, apprehension and penalty do not lead to a higher subjective probability of detection, but rather to a lower probability.

Other violations

For other violations, a (small) effect of higher penalties is often found. International research into red light negation, based on Israeli and US data, shows that every penalty increase by 1% led to a decrease in red light negation by 0.2 % [25]. Dutch research, based on the speeding penalty increases of 1 April 2008 and 1 January 2010, resulted in a similar estimate [26]: if the penalty increases by 1%, the speeding violations (detected by road section control systems) decrease by 0.23%. In both studies, the effects of the penalty increases were measured shortly after the increase and especially on those roads which were usually policed. So the estimate possibly concerns time- and place-bound behavioural effects.

Higher penalties also appear to increase seat belt use. A Norwegian study showed that a 100 NOK (10 €) penalty increase for car occupants not wearing a seat belt was related to an increase in seat belt use by 2.5-5% in rural areas and by 10% in urban areas [27]. In the United States [28] this correlation was also found: a penalty increase from 25 to 60 dollars resulted in 3-4% increase in seat belt use, and a penalty increase from 25 to 100 dollars in a 6-7% increase.

What is the effect of enforcement methods for each priority?

For each of the five national enforcement priorities, the effect of the enforcement efforts on the associated violations are given. Most efforts are combined with information campaigns and media coverage, and sometimes with new legislation.

Repeat traffic offenders

Although repeat traffic offenders represent less than 0.5% of the population, as drivers they are involved in 6% of all crashes [19]. Plenty of reason, therefore, to pay attention to this group by means of enforcement and accompanying measures.

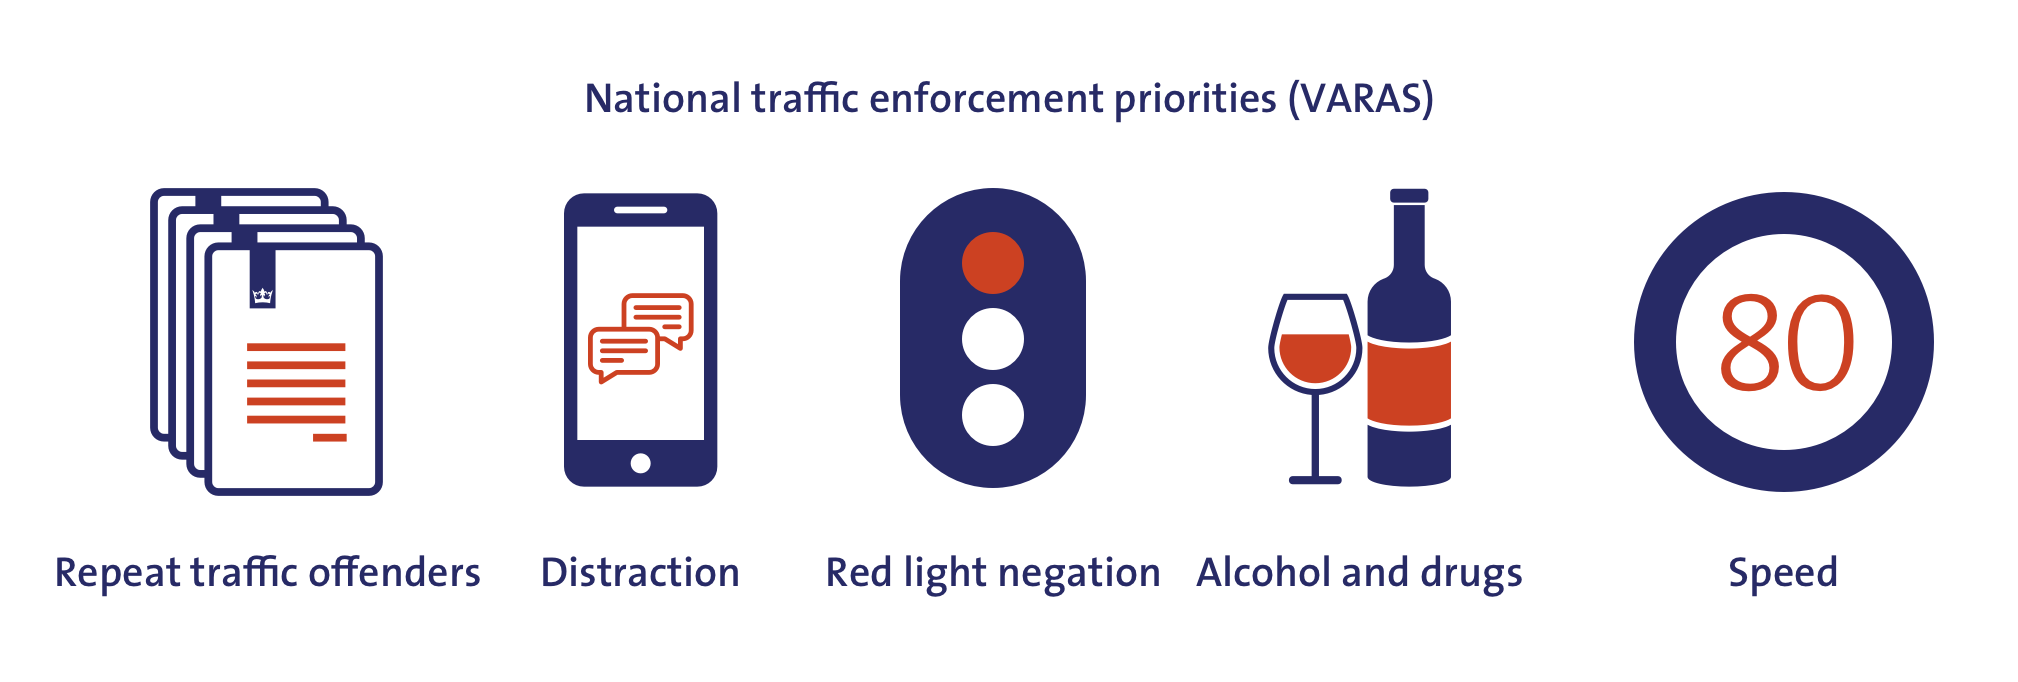
In the Netherlands, research was done into the effect of warning letters to repeat offenders (defined as individuals who often receive fines for annoying or anti-social traffic behaviour). This showed that these warnings led to fewer violations [29]. The warning letters said that a large number of CJIB orders (orders issued by the Central Fine Collection Agency CJIB) were registered under their names/vehicles, that police would intensify surveillance of said individuals/vehicles, and that they were urged to comply with the traffic rules. The letters were signed by the local district chief. For repeat traffic offenders having received a warning letter, the number of fines decreased by 35% in the following year. For a control group of repeat traffic offenders the number of fines decreased by only 3% in the same period.

In the Netherlands, no research is known about the effect of enforcement focusing on repeat traffic offenders. A theoretically possible measure is the introduction of a progressive penalty system. This encompasses higher penalties as more violations are committed, which may, in theory, motivate repeat traffic offenders to adapt their behaviour. A scenario analysis shows that  – on the basis of a few assumptions – a progressive penalty system for speeding could reduce the number of road deaths in the Netherlands by an annual 5% [30]. Also see SWOV fact sheet Progressive penalty systems in traffic.

Distraction

In the Netherlands, several dozens to well over a hundred road deaths in car crashes involve distraction (also see SWOV fact sheet Distraction in traffic ). A ban on specific forms of distraction, coupled with intensive police enforcement of compliance with such a ban, may result in less distracted driving and fewer road deaths [31]. In the United States, an explicit ban on handheld texting in traffic resulted in a 3% reduction of road deaths (95% CI[i]: 0 to 5%) and 7% (95% CI: 1% tot 12%) fewer road injuries, in spite of limited enforcement of compliance [32] [33]. In the US, increasing penalties for texting (a step-up from a secondary offence to a primary offence) only resulted in a temporary effect (three months) [34]. The authors said the effect of the penalty increase diminished so speedily because of the low level of enforcement.

Red light negation

Red light negation at 50km/hour intersections leads to an approximately fourteenfold greater chance of crashes than red light compliance [35]. At 50km/hour intersections with traffic light control, red light negation is definitely or possibly related to 41 to 67% of crashes [35].

A 2017 meta-analysis [36] shows that the implementation of red light cameras is associated with a 61% reduction of red light negations (95% CI: 56 to 64%), 20% fewer road injuries (95% CI: 5 to 32%), 24% fewer side impacts (95% CI: 10 to 35%) and 29% fewer side impacts involving injuries (95% CI: 14 to 42%), but also with 19% more rear-end collisions (95% CI: 9 to 31). These figures concern effect estimates for intersections monitored by cameras. The latest safety effect estimates of red light cameras, based on 2013-2017 studies, confirm this picture [37]: 24% fewer road injuries (95% CI: from a 51% reduction to a 17% increase) and 29% fewer side impacts involving injuries (95% CI: 21% to 36% reduction), but also 14% more rear-end collisions (95% CI: from an 11% reduction to a 46% increase).

Alcohol and drugs

In 2015, an estimated 12 to 23% of the road deaths in the Netherlands were caused by alcohol [38], while one in ten seriously injured drivers was estimated to have used drugs (see SWOV fact sheet The use of drugs and medicines behind the wheel). The combination of drugs and alcohol use leads to higher risks similar to the higher risks related to drink driving with a BAC > 1,2‰, which may be labelled as an extremely high risk (see SWOV fact sheet Driving under the influence of alcohol).

Between 2003 and 2017, the percentage of drivers with an over-the-limit Blood Alcohol Content (BAC) decreased from 3.4% to 1.4%. The share of serious offenders (a BAC > 1.3 ‰) remained at a steady 0.6 to 0.4%. In 2011, it decreased to 0.3% and in 2017 to 0.1% [39]. A note of caution in this respect is that drivers are ever better able to avoid alcohol checks by updated information on social media/in apps [40]. The positive trend may therefore be biased; a group of drivers is still engaged in drink driving, but is better (than before) able to stay under the radar of alcohol checks. A meta-analysis of the results of 40 studies from different countries [41] shows that drink driving enforcement leads to a 17% decrease in crashes (95% CI: 11 to 22%) not corrected for publication bias, and to a 14% decrease (95% CI: 11 to 18%) corrected for publication bias [ii]. There is no proof that higher penalties for alcohol offenders affect violation reduction (see SWOV fact sheet Driving under the influence of alcohol).

On 1 July 2017, legal limits for drug use in traffic were introduced. No evaluations of the road safety effect of this legislation and its enforcement are known. Drug legislation and enforcement in traffic are expected to have both a general preventive effect and an offender-specific effect. It should be noted, however, that drug and medicine use causes far fewer road casualties than alcohol use does. If traffic enforcement for drugs were carried out at the expense of traffic enforcement for alcohol use, this would have a negative effect on road safety [42].

Speed

International research shows that about one third of fatal crashes are (partly) caused by speeding or by improper speeds (see SWOV fact sheet Speed and speed management).

A meta-analysis of studies on speed enforcement [43] shows that implementation of camera enforcement results in a 7% speed reduction (95% CI: 0 to 13%), a 57% decrease in the share of speed offenders (95% CI: 50 to 64%), a 19% decrease in the number of crashes (95% CI: 14 to 24%), an 18% decrease in the number of road injuries (95% CI: 13 to 23%) and a 21% decrease in the number of serious and fatal crashes (95% CI: 13 to 29%). A meta-analysis specifically focusing on the effects of road section control (average speed check), found that this method resulted in a 30% decrease in all crashes (95% CI: 24 to 36%) and a 56% decrease in serious crashes (resulting in fatal or serious injuries) (95% CI: 42 to 66%) [44].


[i] The confidence interval (CI) is a range of values it is fairly certain the true value lies in. The 95% interval indicates that the true mean is 95% likely to be between the minimum and maximum value. For example: an estimated effect of 57% with a CI of 50 to 65% means that the true effect is 95% likely to be between 50 and 65%.

[ii] Publication bias is the bias that occurs when positive results of scientific research are pubished, but negative or unequivocal results are not.

What are rehabilitation courses and how effective are they?

Educational measures or rehabilitation courses are intended to teach road users to avoid inappropriate road user behaviour. Such courses are intended to raise awareness of the causes and risks related to inappropriate behaviour and present opportunities for behavioural adaptation to avoid problems. Participants have to pay for these courses themselves.

In the Netherlands, there are rehabilitation courses for alcohol offenders: EMA (Educational Measure Alcohol) and LEMA (Light Educational Measure Alcohol). LEMA targets novice drivers caught at drink driving with a BAC of 0.2 to 0.5 ‰ and experienced drivers with a BAC of 0.8. to 1.0 ‰. EMA is imposed in case of still higher  BACs or in case of repeat offences. Both courses address the risks of alcohol use in traffic and the need to decouple alcohol use and traffic participation. During the courses, participants exchange experiences and complete assignments, both at home and at the training location. The course ends with a two-hour conversation with the trainer. LEMA takes two afternoons or two mornings with a two-week interval. The two-day EMA course spans a period of seven weeks.

In a study, the Scientific Research and Documentation Centre (Dutch abbreviation: WODC) did not find any demonstrable effect of LEMA on repeat offences (both repeat traffic offences in general and repeat offences concerning drink driving) [45]. A WODC study about EMA effectiveness is expected to appear in late 2019.

Apart from (L)EMA,  there is also an Educational Measure Behaviour and Traffic (Dutch abbreviation EMG). This measure is specifically intended for drivers who have repeatedly displayed inappropriate driving behaviour during one drive. A one-off serious overspeeding offence may also result in the road user’s referral to EMG. The WODC study [45] showed that within two years 30% of the drivers completing an EMG in 2013 was faced with the justice system for any offence, 20% committed a new traffic offence and 12% were sentenced after a new EMG-related offence.

An overview of international studies of the effects of offender rehabilitation programmes [46] showed large effect variations. It concluded that the effectiveness of rehabilitation programmes increases when they are coupled with a driving licence measure, when a previous problem diagnosis and selection is applied, when road users are coached individually, when road users are well able to monitor their own behaviour, and when they are approached in an emphatic instead of a confrontational way.

A meta-analysis of six recent international studies shows that drink driving rehabilitation programmes may reduce the number of repeat offenders by 49% [47], provided such programmes are clearly aimed at behaviour plans that may assist an offender threatening to relapse in alcohol abuse, and provided that they entail several weeks of coaching.

Also see the archived SWOV fact sheet Rehabilitation courses for road users and the question about EMA and LEMA in SWOV fact sheet Driving under the influence of alcohol.

What are effective methods for tackling serious offenders?

In general, serious traffic offenders are hard to influence with common measures, such as imposing fines. A suspension or invalidation of the driving licence can be effective, particularly if coupled with a different measure, such as personal or group coaching and monitoring [48]. A problem related to this measure is that part of the drivers continue to drive even without a valid licence [49].

In general, a penalty is most effective for serious offenders if it entails a combination of cohesive components (such as temporary vehicle confiscation, driving licence suspension, or a fine), or the choice of a rehabilitation programme in exchange for a speedier vehicle or licence return, or a combination of monitoring alcohol use and personal coaching [50] [51]. The penalty should both be severe and encourage behaviour improvement (in exchange for a penalty reduction).

Serious alcohol offenders

For serious alcohol offenders, an alcohol lock has proved to have the greatest preventive effect and to be more effective than suspension or invalidation of the driving licence [52].

A 2011 meta-analysis [53] showed that an alcohol lock programme reduces the risk of repeat offending by 75% during the time the measure applies. Results of more recent studies are consistent with this outcome [52]. They also show a significantly lower risk of repeat offending and also only during the time the alcohol lock is present. Swedish findings do, however, show that alcohol lock programmes may indeed result in permanent changes, both in alcohol consumption and in driving behaviour, even after the programme has ended and the alcohol lock has been removed [54] [55]. The researchers say the changes are permanent because of the integrated programme approach: it not only tackles the symptoms of the alcohol problem but also its causes. An important component in this integrated approach is that, even after removal of the alcohol lock, frequent medical check-ups continue [54]. In March 2015, the Council of State of the Netherlands decided that the Driving Test Organisation CBR should no longer be allowed to impose an alcohol lock programme. The most important argument was that the administrative regulatory provision, so a provision without court intervention, could prove to be disproportionate in a large number of cases. After consultation with experts, the minister of Justice and Security and the minister of Infrastructure and Water Management concluded that other measures were preferable to re-introduction of the alcohol lock (in criminal law) [56].

A relatively new penalty for alcohol offenders is monitoring alcohol use by means of an alcohol monitoring ankle bracelet, possibly coupled with a special behavioural therapy programme. Abroad, results of monitoring by means of anklets are mostly positive [57] [58] [51]. In the Netherlands, a pilot project involving anklets for alcohol offenders (so not only drink driving offenders) ran in 2017 and 2018. This so-called ‘Alcohol Monitor’ was coupled with supervision by the probation service. The Dutch results were also positive, although it should be noted that project participation was voluntary [59].

Serious speeding offenders

Studies were done to see whether monitoring of and giving feedback about serious offender behaviour could improve behaviour. Studies in 2014 showed that such measures usually lead to a clearly improved driving style [60] [61]. Drivers do, however, relapse as soon as feedback is stopped. Yet, the closer feedback is coupled with a personal coaching programme and the more intensive the programme is, the longer the driving style improvement lasts.

How effective are rewards for good behaviour?

Rewarding good road user behaviour may lead to more appropriate and safe behaviour, provided the reward system meets certain critical conditions. One study, for instance, clearly shows that young Dutch drivers are prepared to moderate speed if they are rewarded by insurance premium discounts [62]. In order to achieve long-term effects, a rewards programme needs to be regularly repeated.

Conditions for a successful reward programme are among others [63] [64] [65]:

  • It is clear that the reward depends on displayed behaviour and when and how rewards are effected.
  • Desired behaviour is specific, measurable and feasible.
  • Behaviour is regularly monitored, but desired behaviour not continuously rewarded.
  • It is important to see others receive rewards.
  • Rewards are direct, instant and attractive; they may also involve chances of a reward via a lottery.
  • Rewards are large enough to induce behavioural change, but not so large that they are the only incentive for desired behaviour.
  • The reward programme is progressive: more successes lead to higher rewards.
  • The (chance of a) reward is equal for everyone, or considered equal.
  • Information about the reward program does not only cover the rewards, but also the relevance (benefit) to the road users themselves, such as their safety.
  • There is fast and clear feedback on behaviour and, possibly, on progress made to achieve set goals.
  • The reward programme pairs well with police enforcement.

Also see the archived SWOV fact sheet Rewards for safe road behaviour.

What does traffic enforcement for non-driving road users look like?

Traffic enforcement mainly focuses on lorry and car drivers. Other road users, however, also have to comply with traffic rules. In general, enforcement for these groups is far less common and less structural. There are no precise data about how and when the rules are enforced.

Pedestrians

Police may fine pedestrians for offences, such as red light running, ignoring red (flashing) lights at level crossings and bridge crossings, ignoring no-entry signs (sign C16), or ignoring a stop sign used by police/crossing guard (red light, flag etc.). Police may also fine pedestrians for public drunkenness. Research data about the practice of traffic enforcement for pedestrians are not available.

Cyclists

Police may fine cyclists for cycling without lights, ignoring a red light, driving against travel direction or not giving way to other traffic. Bicycle defects are also subject to fines, e.g. faulty lighting, no reflectors on pedals or wheels, no/a broken bell or faulty brakes. An overview of cyclist fines is presented at: www.fietsersbond.nl/ons-werk/wetten-en-regels/boetes-voor-fietsers/.

In 2019, texting while cycling was added to the cyclist fine list. Since 1 July 2019, traffic participation while using handheld electronic devices, such as mobile phones, laptops and music players has also been forbidden for cyclists. There are no data available about the extent to which this ban is enforced.

In the Netherlands, police check bicycle lights every year, particularly in support of information and education campaigns about bicycle lighting. In recent years, police have imposed about 25,000 fines for faulty bicycle (and light moped) lighting. When the police receive a large number of complaints about cyclists on the pavement or in a shopping zone, they will also (occasionally) enforce this rule.  

Light mopeds

Police can fine light moped riders for violations, such as vehicle-related offences (including hardly legible licence plates, faulty lighting, horn or brakes), road user-related offences (including alcohol offences, failure to wear a helmet, not being able to show a driving licence, insurance or registration certificate) and speeding. An overview of light moped fines is presented at: www.scooternews.nl/scooter-boetes/.

Concerning speed, tuning up light mopeds deserves special attention (exceeding the maximum 25 km/hour construction speed). Both tuning up itself and speeding are vigorously dealt with [66]. A light moped rider exceeding the 25 km/hour limit receives a fine that is equal to the fine for speeding car drivers. In addition, police can suspend the AM licence if a speed of 30km/hour or higher is maintained. If the speed violation reveals that the vehicle has been tuned up, police may not only impose a fine, but also require the vehicle to be tested by RDW once more [66]. There are no data about enforcement efforts, the number of fines, or other penalties for speeding light moped riders. In 2019, the Amsterdam city council introduced new traffic rules for light mopeds. Since 8 April 2019, light moped riders have been legally obliged to ride on the roadway at designated areas within the A10 ring road, and to wear a helmet. Since 3 June 2019, offenders have been fined 95€. As yet there are no data about enforcement and behavioural effects.

Moped riders

Police can fine light moped riders for violations, such as vehicle-related offences (including hardly legible licence plates, faulty lighting, horn or brakes), road user-related offences (including alcohol offences, failure to wear a helmet, not being able to show a driving licence, insurance or registration certificate) and speeding.

Similar to light moped checks, police checks speeding mopeds for tuning up the maximum construction speed of 45 km/hours [67]. Both tuning up itself and speeding are vigorously dealt with [66].Not much is known about the safety effects of special enforcement projects concerning moped riders, partly because the projects are often small-scale and short-term [67].

What is the difference between administrative sanctions and punitive procedures?

Administrative sanctions are imposed for minor offences. Sanctions are based on the Administrative Traffic Enforcement Act (Dutch abbreviation: WAHV), the so-called ‘Mulder Act’. In case of camera enforcement, the registration holder is held accountable for offences, whether he was driving or not. Examples of administrative sanction offences are exceeding the speed limit by less than 30km/hour on non-motorways or less than 40 km/hour on motorways, and red light negation. Sanction processing does not take repeat offending into account.

Punitive sanctions are imposed in case of more serious traffic violations, such as excessive speeding, drink driving, causing a road injury crash, and driving without a driving licence. A punitive procedures does take repeat offending into account, which generally leads to higher penalties. What constitutes a traffic offence is laid down in the Road Traffic Act and the Dutch Penal Code. A road user suspected of a traffic violation may be summoned to a district or police court. Traffic offences are also often dealt with by the Netherlands Public Prosecution Service itself. For punitive sanction offences, police reports are filed.

Are police stops more effective than computerised surveillance?

Both police stops and camera surveillance positively affect road safety and both have benefits and drawbacks. Camera surveillance enables monitoring of large traffic amounts, which police stops cannot do. Camera surveillance of speed and red light negation have proved to be effective in reducing offences and the number of crashes (see the question What is the effect of enforcement methods for each priority? ). An important drawback of camera surveillance is that the offender will only receive the fine a few days or weeks after the actual offence. This may obscure the link with dangerous road user behaviour.

A number of violations can’t be detected by camera surveillance. Examples are drink or drug driving, aggressive driving, violation of rest and driving times legislation, overloading and tuning up construction speed. Therefore, police stops are a necessary addition to camera surveillance. Moreover, in individual cases, police stops generate more impact than camera surveillance. First of all, because police can clarify the reason for a fine. Road users themselves say that unsanctioned warnings during a police stop have the most long-term behavioural effect [68]. Secondly, police stops may lead to criminal records with further-reaching implications, such as a higher penalty when the court takes account of previous criminal offences. Furthermore, road police stops are necessary to implement measures based on individual road user-related offences, such as the provisional licence for novice drivers, the demerit point licence and the repeat offender scheme [11]. In addition, police stops enable police to check for other potential offences apart from the priority offence. Finally, visible police presence in traffic and police stops of offenders confirms the rules and enjoys broad public support [11].

What is the effect of prior police check announcements (on the radio for instance)?

The effect of prior announcement of speed or alcohol checks via radio or other media has not been studied. Such prior announcements enable people to avoid fines by adapting their behaviour on the relevant road section or to choose an alternative route to avoid the police check. The latter seems to happen, for instance, when social media are used to warn about ‘alcohol traps’. Such large-scale, static alcohol checks may therefore have become less effective. That is why the police focus on individual checks.

Prior police check announcement may, however, also have a positive effect. If people often hear such announcements, they get the impression that police are often active, and at different road sections. This will lead to a higher subjective probability of detection, which is one of the crucial elements of an effective enforcement policy (also see the question What does traffic enforcement effectiveness depend on?).

Is the secondary road network also policed?

The secondary road network is also policed, but enforcement on 30 km/hour roads is limited. In 2016, out of almost 8 million speed fines, only 5,467 (or 0.1%) were issued for offences in 30 km/hour zones. The Public Prosecution Office takes the view that, when a 30km/hour zone does not meet the design requirements, police should be hesitant to correct this by means of traffic enforcement. If a 30km/hour zone is basically well-designed and violations occur nonetheless, police may decide to indeed enforce the rules.

An MUConsult field study [68] argues that speed checks in urban areas are more effective than checks in rural areas; one of the reasons being that urban speed violations are less socially acceptable than rural speed violations.

Does a change in the number of fines mean that road users behave better or worse?

An increase or decrease in the number of fines does not imply that the number of violations has also increased or decreased. The number of fines is actually largely dependent on the amount of traffic and on enforcement frequency. If in a given year (car) mobility has decreased or police checks have become less frequent, the total number of imposed fines will also decrease, even though the number of violations may have remained stable.

What do road users think about traffic enforcement?

A 2017 study shows that 80% of the respondents think police surveillance on motorways is (very) useful [69], up from 67% in 2016. Over half the respondents (56%) think there could be more police surveillance. The respondents also think police should especially monitor anti-social driving behaviour (79%), distraction behind the wheel (66%) and alcohol and drug use (45%). It is remarkable that more respondents call for more surveillance of distraction behind the wheel; a 10% rise compared to 2016

Publications and sources

Below you will find the list of references that are used in this fact sheet. All sources used can be consulted or retrieved via our Library portal. Here you can also find more literature on this subject.

[1]. Ministerie van VenJ (2012). Inrichtingsplan Nationale Politie. Ministerie van Veiligheid & Justitie, Den Haag.

[2]. Terpstra, J., Duijneveldt, I. van, Eikenaar, T., Havinga, T., et al. (2016). Basisteams in de Nationale Politie - organisatie, taakuitvoering en gebiedsgebonden werk. Politie & Wetenschap, Vaksectie Strafrecht en Criminologie, Faculteit Rechtsgeleerdheid, Radboud Universiteit Nijmegen, Apeldoorn.

[3]. Ministerie van JenV (2019). Uitwerking Veiligheidsagenda 2019 – 2022. Vastgesteld in het LOVP van 3 december 2018. Ministerie van Justitie en Veiligheid, Den Haag.

[4]. Goldenbeld, C., Stelling-Kończak, A. & Kint, S. van der (2019). Verkeershandhaving op Nederlandse autosnelwegen. Evaluatie van de werkwijze van het Team EVT, de effecten en de acceptatie van politiecontroles. R-2019-13. SWOV, Den Haag.

[5]. VNG (2016). Handhaving sterk in de openbare ruimte. Omdat de burger dat van ons verwacht. VNG-visie handhaver 2020. Vereniging van Nederlandse Gemeenten, Den Haag.

[6]. VNG (2016). Bestuurlijke boeteoverlast in de openbare ruimte en lichte verkeersovertredingen (domein 1 Openbare ruimte). Vereniging van Nederlandse Gemeenten, Den Haag.

[7]. CVOM (2015). Leidraad Handhavingsplan Verkeer 2016-2018. Parket Centrale Verwerking Openbaar Ministerie, Afdeling Beleid & Strategie, Openbaar Ministerie, Utrecht.

[8]. CJIB (2015). Ruim 8 miljoen verkeersovertredingen in 2014. Retrieved on 17-06-2019 at https://www.cjib.nl/ruim-8-miljoen-verkeersovertredingen-2014

[9]. CJIB (2016). Bijna 8 miljoen verkeersovertredingen in 2015. Retrieved on 17-06-2019 at https://www.cjib.nl/bijna-8-miljoen-verkeersovertredingen-2015.

[10]. Ministerie van Financiën (2016). Interdepartementaal Beleidsonderzoek Verkeershandhaving. Ministerie van Financiën, Den Haag.

[11]. Goldenbeld, C. & Houwing, S. (2015). Staandehoudingen in het verkeer; Signalering van achtergronden en ontwikkelingen in de verkeershandhaving. Interne SWOV-notitie.

[12]. NOS (2017). Aantal alcoholcontroles afgelopen drie jaar gehalveerd. NOS. Retrieved on 04-06-2019 at https://nos.nl/artikel/2156235-aantal-alcoholcontroles-afgelopen-drie-jaar-gehalveerd.html.

[13]. Adminaite, D., Jost, G., Stipdonk, H. & Ward, H. (2016). How traffic law enforcement can contribute to safer roads. PIN Flash Report 31. European Transport Safety Council ETSC.

[14]. OM (2018 ). Tekstenbundel voor misdrijven, overtredingen en Muldergedragingen. Openbaar Ministerie, Den Haag.

[15]. Wolswijk, H.D., Postma, A. & Keulen, B.F. (2017). Ernstige verkeersdelicten. Rijksuniversiteit Groningen, Groningen.

[16]. Goldenbeld, C. (2005). >Verkeershandhaving in Nederland; Inventarisatie van kennis en kennisbehoeften. [Traffic enforcement in the Netherlands; an inventory of knowledge and knowledge needs]. R-2004-15. Summary in English]. SWOV, Leidschendam.

[17]. Goldenbeld, C., Wijk, A.P. van & Mesken, J. (2013). Sancties in het verkeer. Een vergelijking tussen het terrein van de verkeersveiligheid en de jeugdcriminaliteit. [Sanctions in traffic. Scientific essays on sanctions in and outside traffic]  R-2013-10 [Summary in English]. SWOV, Leidschendam.

[18]. Goldenbeld, C. & Twisk, D.A.M. (2009). Verkeersovertredingen, veelplegers en verkeersonveiligheid. Kennis uit bestaand onderzoek[Traffic offences, multiple offenders and road safety. Knowledge from existing research]. R-2009-7 [Summary in English]. SWOV, Leidschendam.

[19]. Goldenbeld, C., Reurings, M.C.B., Norden, Y. van & Stipdonk, H.L. (2011). Relatie tussen verkeersovertredingen en verkeersongevallen. [The relation between traffic offences and road crashes. Preliminary study making use of Central Fine Collection Agency (CJIB) data].  R-2011-19 [Summary in English]. SWOV, Leidschendam.

[20]. Mathijssen, M.P.M. (1994). Rijden onder invloed in Nederland, 1992-1993; Ontwikkeling van het alcoholgebruik van automobilisten in weekendnachten. R-94-21 [Summary in English]. SWOV, Leidschendam.

[21]. Wagenaar, A.C., Maldonado-Molina, M.M., Erickson, D.J., Ma, L., et al. (2007). General deterrence effects of U.S. statutory DUI fine and jail penalties: Long-term follow-up in 32 states. In: Accident Analysis & Prevention, vol. 39, nr. 5, p. 982-994.

[22]. Briscoe, S. (2004). Raising the bar: can increased statutory penalties deter drink-drivers? In: Accident Analysis & Prevention, vol. 36, nr. 5, p. 919-929.

[23]. Moffatt, S. & Poynton, S. (2007). The deterrent effect of higher fines on recidivism: Driving offences. In: Crime and Justice Bulletin 2007, vol. 106.

[24]. Pogarsky, G. & Piquero, A.R. (2003). Can Punishment Encourage Offending? Investigating The “resetting” Effect. In: Journal of Research in Crime and Delinquency, vol. 40, nr. 1, p. 95-120.

[25]. Bar-Ilan, A. & Sacerdote, B. (2001). The response to fines and probability of detection in a series of experiments. Working Paper 8638. National Bureau of Economic Research. NBER, Cambridge, Massachusetts.

[26]. Moolenaar, D.E.G., Zuidema, T. & Boer, J. de (2011). De afname van het aantal boetes en transacties voor verkeersovertredingen nader verklaard. Cahier 2011-9. WODC, Den Haag.

[27]. Elvik, R. & Christensen, P. (2007). The deterrent effect of increasing fixed penalties for traffic offences: The Norwegian experience. In: Journal of Safety Research, vol. 38, nr. 6, p. 689-695.

[28]. Nichols, J.L., Tippetts, A.S., Fell, J.C., Auld-Owens, A., et al. (2010). Strategies to increase seat belt use: An analysis of levels of fines and the type of law. DOT HS 811 413. NHTSA, Washington.

[29]. Bieleman, B., Boendermaker, M., Mennes, R. & Snippe, J. (2014). Hard op weg. Onderzoek naar verkeersveelplegers. Politiekunde 65, Politie en Wetenschap. Reed Business, Amsterdam, Apeldoorn.

[30]. Hoekstra, A.T.G., Eenink, R.G. & Goldenbeld, C. (2017). Progressief boetestelsel en verkeersveiligheid. Geschatte veiligheidseffecten van hogere boetes bij herhaalde snelheidsovertredingen. [Progressive penalty system and road safety. Estimated safety effects of progressive fines for repeated speeding offences]. R-2017-3 [Summary in English].  R-2017-3. SWOV, Den Haag.

[31]. Vlakveld, W. (2018). Maatregelen tegen afleiding bij automobilisten. Een literatuurstudie[Measures against distraction of drivers. A literature study].  R-2018-22 [Summary in English]. SWOV, Den Haag.

[32]. Ferdinand, A.O., Menachemi, N., Sen, B., Blackburn, J.L., et al. (2014). Impact of texting laws on motor vehicular fatalities in the United States. In: American Journal of Public Health, vol. 104, nr. 8, p. 1370-1377.

[33]. Ferdinand, A.O., Menachemi, N., Blackburn, J.L., Sen, B., et al. (2015). Government, law, and public health pratice. The impact of texting bans on motor vehicle crash-related hospitalizations. In: American Journal of Public Health, vol. 105, nr. 5, p. 859-865.

[34]. Abouk, R. & Adams, S. (2013). Texting bans and fatal accidents on roadways: Do they work? Or do drivers just react to announcements of bans? In: American Economic Journal: Applied Economics, vol. 5, nr. 2, p. 179-199.

[35]. Aarts, L.T., Loenis, B., Korving, H. & Guiking, C. (2017). Risicofactoren op 50km/uur-kruispunten met verkeerslichten. Methodologische verdieping en verdere verkenning van de kwantificering van risicofactoren zoals roodlichtnegatie[Risk factors at 50 km/h intersections with traffic lights. Methodological follow-up and further exploration of the quantification of risk factors such as red light runningrunning] R-2017-21 [Summary in English].  SWOV, Den Haag.

[36]. Perkins, C., Steinbach, R., Edwards, P., Beecher, D., et al. (2017). Red light enforcement cameras to reduce traffic violations and road traffic injuries. College of Policing and the Economic and Social Research Council (ESRC), London.

[37]. Goldenbeld, C., Daniels, S. & Schermers, G. (2019). Red light cameras revisited. Recent evidence on red light camera safety effects. In: Accident Analysis & Prevention, vol. 128, p. 139-147.

[38]. SWOV (2016). In 2015 75 tot 140 verkeersdoden als gevolg van alcohol. SWOV. Retrieved on 05-06-2018 athttps://www.swov.nl/nieuws/2015-75-tot-140-verkeersdoden-als-gevolg-van-alcohol

[39]. I&O Research (2018). Rijden onder invloed in Nederland in 2002-2017: ontwikkeling van het alcoholgebruik van automobilisten in weekendnachten. Ministerie van Infrastructuur en Waterstaat, Water, Verkeer en Leefomgeving WVL, ‘s-Gravenhage.

[40]. Minister van VenJ (2017). Antwoorden op Kamervragen over het aantal alcoholcontroles in het verkeer. Brief aan Tweede kamer. Ministerie van Justitie en Veiligheid, Den Haag.

[41]. Erke, A., Goldenbeld, C. & Vaa, T. (2009). The effects of drink-driving checkpoints on crashes—A meta-analysis. In: Accident Analysis & Prevention, vol. 41, nr. 5, p. 914-923.

[42]. Veisten, K., Houwing, S. & Mathijssen, R. (2010). Cost-benefit analysis of drug driving enforcement by the police. Deliverable D3.3.1 of the EU FP6 project DRUID. European Commission, Brussels.

[43]. Steinbach, R., Perkins, C., Edwards, P., Beecher, D., et al. (2016). Speed cameras to reduce speeding traffic and road traffic injuries. Cochrane Injuries Group, London School of Hygiene & Tropical Medicine, London.

[44]. Høye, A. (2014). Speed cameras, section control, and kangaroo jumps–a meta-analysis. In: Accident Analysis & Prevention, vol. 73, p. 200-208.

[45]. Blom, M., Blokdijk, D. & Weijters, G. (2017). Recidive na een educatieve maatregel voor verkeersovertreders of tijdens een Alcoholslotprogramma. Cahier 2017-15. Wetenschappelijk Onderzoek- en Documentatiecentrum WODC, Den Haag.

[46]. SUPREME (2007). Thematic report: Rehabilitation and diagnostics. Directorate-General for Transport and Energy (TREN), European Commission, Brussels.

[47]. Slootmans, F., Martensen, H., Kluppels, L. & Meesmann, U. (2017). Rehabilitation courses as alternative measure for drink-driving offenders. European Road Safety Decision Support System, developed by the H2020 project SafetyCube. Retrieved on 09-11-2018 at www.roadsafety-dss.eu.

[48]. Goldenbeld, C. (2017). Licence suspension. European Road Safety Decision Support System, developed by the H2020 project SafetyCube. Retrieved on 09-11-2018 at www.roadsafety-dss.eu.

[49]. Vis, M.A., Goldenbeld, C. & Bruggen, B. van (2010). Rijden zonder geldig rijbewijs in Nederland. Hoe vaak komt het voor en wat betekent het voor de verkeersveiligheid?  [Driving without a valid licence in the Netherlands. How frequent is it and what does it mean for road safety?]  R-2010-13 [Summary in English]. SWOV, Leidschendam.

[50]. Miller, P.G., Curtis, A., Sonderlund, A., Day, A., et al. (2015). Effectiveness of interventions for convicted DUI offenders in reducing recidivism: A systematic review of the peer-reviewed scientific literature. In: The American journal of drug and alcohol abuse, vol. 41, nr. 1, p. 16-29.

[51]. Averill, F., Brown, T.G., Robertson, R.D., Tchomgang, A., et al. (2018). Transdermal alcohol monitoring combined with contingency management for driving while impaired offenders: A pilot randomized controlled study. In: Traffic injury prevention, vol. 19, nr. 5, p. 455-461.

[52]. Nieuwkamp, R., Martensen, H. & Meesmann, U. (2017). Alcohol interlock. European Road Safety Decision Support System, developed by the H2020 project SafetyCube. Retrieved on 01-03-2018 at www.roadsafety-dss.eu.

[53]. Elder, R.W., Voas, R., Beirness, D., Shults, R.A., et al. (2011). Effectiveness of Ignition Interlocks for Preventing Alcohol-Impaired Driving and Alcohol-Related Crashes: A Community Guide Systematic Review. In: American Journal of Preventive Medicine, vol. 40, nr. 3, p. 362-376.

[54]. Bjerre, B. & Thorsson, U. (2008). Is an alcohol ignition interlock programme a useful tool for changing the alcohol and driving habits of drink-drivers? In: Accident Analysis & Prevention, vol. 40, nr. 1, p. 267-273.

[55]. Gustafsson, S. & Forsman, A. (2016). Utvärdering av alkolås efter rattfylleri: enkätstudie [Evaluation of a Swedish alcohol interlock program for drink driving offenders: questionnaire study]. VTI-code: 35-2016; summary in English. VTI, Linköping.

[56]. Minister van JenV en IenW (2018). Aanpak rijden onder invloed van alcohol. Kamerstuk 29 398 nr. 588. Brief regering dd. 7 maart 2018.

[57]. McKnight, A.S., Fell, J.C. & Auld-Owens, A. (2012). Transdermal alcohol monitoring: Case studies. Report No. DOT HS 811 603. National Highway Traffic Safety Administration, Washington, DC.

[58]. Tison, J., Nichols, J.L., Casanova, T. & Chaudhary, N.K. (2015). Comparative study and evaluation of SCRAM use, recidivism rates, and characteristics. DOT HS 812 143. Department of Transportation DOT, National Highway Traffic Safety Administration NHTSA, Washington, D.C.

[59]. Grapperhaus, F. (2018). Kamerbrief Evaluatie eerste pilotjaar Alcoholmeterv. Kamerbrief 2445831. Ministerie van Justitie en Veiligheid.

[60]. Pas, J.W.G.M. van der, Kessels, J., Veroude, B.D.G. & Wee, B. van (2014). Intelligent speed assistance for serious speeders: The results of the Dutch Speedlock trial. In: Accident Analysis & Prevention, vol. 72, p. 78-94.

[61]. Pas, J.W.G.M. van der, Kessels, J., Vlassenroot, S.H. & Wee, B. van (2014). The pros and cons of Intelligent Speed Adaptation as a restrictive measure for serious speed offenders. In: Transportation Research Part A: Policy and Practice, vol. 67, p. 158-174.

[62]. Bolderdijk, J.W., Knockaert, J., Steg, E.M. & Verhoef, E.T. (2011). Effects of Pay-As-You-Drive vehicle insurance on young drivers’ speed choice: Results of a Dutch field experiment. In: Accident Analysis & Prevention, vol. 43, nr. 3, p. 1181-1186.

[63]. Goldenbeld, C. & Reurings, M.C.B. (2012). Kansrijkheid van beloningsscenario's in de provincie Limburg.[Feasibility of reward scenarios in the province of Limburg. An assessment based on literature]. D-2012-2 [Summary in English]. SWOV, Leidschendam.

[64]. Hagenzieker, M.P. (1999). Rewards and road user behaviour. An investigation of the effects of reward programs on safety belt use. Doctoral thesis Rijksuniversiteit Leiden, Leiden.

[65]. Hagenzieker, M.P. (2005). Beloning voor veilig rijden. In: Het Tijdschrift voor de Politie, vol. 66, nr. 10, p. 29-32.

[66]. Ministerie van IenM (2016). Beantwoording motie Hoogland plan van aanpak snorfietsoverlast en motie De Rouwe evaluatie  maatregelen snorfietsoverlast. Brief 31 oktober 2016 aan de voorzitter van de Tweede Kamer der Staten-Generaal. Ministerie van Infrastructuur en Milieu, Den Haag.

[67]. Goldenbeld, C., Groot-Mesken, J. de & Zwan, S. van der (2014). Inventarisatie van handhavings- en educatieprojecten gericht op de bromfiets. [Survey of enforcement projects and education projects aimed at moped riders]. R-2014-4 [Summary in English]. SWOV, Den Haag.

[68]. MuConsult (2019). Effect van handhaving in het verkeer. Snelheid, roodlichtnegatie, alcohol en afleiding. MuConsult, Amersfoort.

[69]. RWS (2018). Publiekspanel Rijkswegen Noord. Resultaten peiling 4 december 2017. Rijkswaterstaat Noord-Nederland, Leeuwarden.

8 + 3 =
Solve this simple math problem and enter the result. E.g. for 1+3, enter 4.

Would you like to cite this fact sheet?

SWOV publication

This is a publication by SWOV, or that SWOV has contributed to.