Pedestrians

Updated

A pedestrian fall or collision is only a road crash (pedestrian crash) when a moving vehicle is involved. Between 2010 and 2019, an annual average of 59 pedestrians were killed in road crashes. Between 1999 and 2019, the number of pedestrian road deaths dropped by 62%. Crash risk for pedestrians equals that for cyclists, while for (light) moped riders crash risk is 3 to 4 times higher, and for occupants of cars/delivery vans 7 to 8 times lower.

Most serious crashes involving pedestrians take place in urban areas and have a car as crash opponent. Important factors in pedestrian crashes are the speed at which cars are driving, the pedestrian’s appraisal of the speed of the car, distraction and lighting. It is often older pedestrians who are prone to road crashes. In a collision between a pedestrian and a motor vehicle, the impact energy is largely transferred to the pedestrian’s body: the fatality rate is therefore considerable. At an impact speed below 30km/h, though, chances of survival are reasonably high.

The possibility to cross distributor roads in the urban area should be restricted to intersections. If a crossing at a road section nevertheless proves necessary, a sustainably safe crossing (SSP) is preferable. Other measures to increase pedestrian safety are improving school routes and other routes frequently used by young pedestrians (e.g. the ‘safe wave’, a safe children’s route), a pedestrian-friendly car front and truck side shields.

Which road users are pedestrians and where are they allowed to walk?

A pedestrian is a road user that does not drive or ride a vehicle. According to the Dutch Traffic Code (Reglement Verkeersregels en Verkeerstekens (RVV)), pedestrian traffic regulations also apply to:

  • Occupants of disability vehicles using the pavement or footpath or crossing from one pavement or footpath to the next;
  • Pedestrians that are pushing a motorcycle, moped or bicycle, and those that are propelling themselves forward by means of objects other than vehicles[i].

Pedestrians are allowed to use bicycle tracks, bicycle/moped tracks, pavements or footpaths. They are only allowed to use the carriageway when being part of a column, a parade or a funeral procession. Pedestrians are also allowed to use the roads of a home zone or shopping precinct across its full width.


[i] Objects other than vehicles are scooters, skateboards and suchlike.

How much and where do pedestrians walk?

From 2010 to 2018, pedestrians walked an annual average of 5.6 billion kilometers (Figure 1; also see SWOV table ‘Kilometres travelled, calculated from data supplied by the ‘Survey of Journeys in the Netherlands’ (Statistics Netherlands), adjusted for holiday traffic’: [1]).

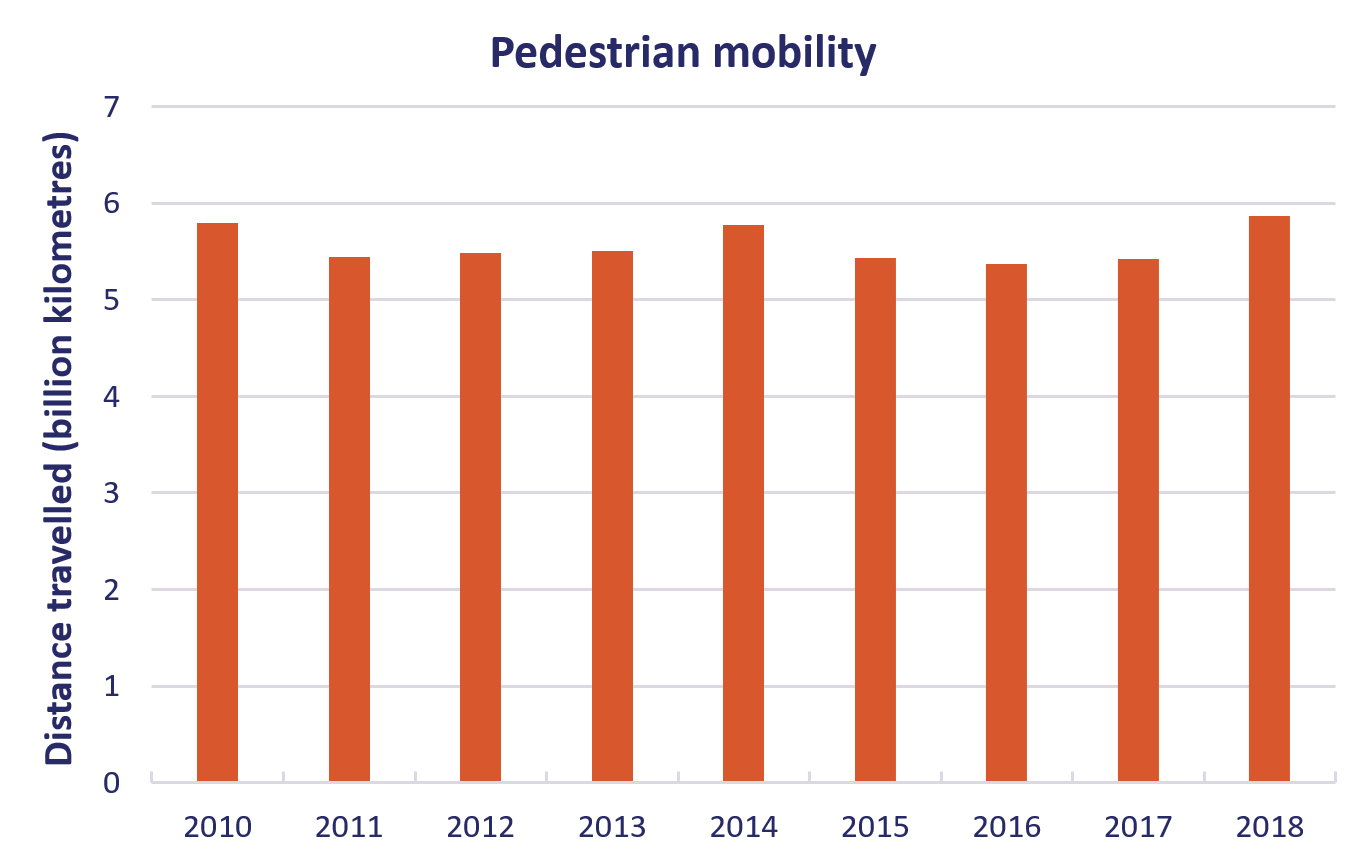
Figure 1. Distance travelled by pedestrians in 2010-2018 (source: Statistics Netherlands, OVIV/ODiN data (2018), edited by SWOV, including an estimate of holiday traffic and an addition of child data (2018) [1]).

The distance travelled by pedestrians in Figure 1 is 2.8% of the distance travelled by all road users in 2010-2018. In 2017, 18% of all trips were pedestrian trips [1]. It should be noted that this is an underestimate of the actual number of trips.

When is a pedestrian fall or collision considered a road crash and how many casualties are there among pedestrians?

According to the definition of a road crash (introduced by Statistics Netherlands in 1926), a pedestrian fall or collision is only considered a road crash when a moving vehicle is involved. Road crashes (pedestrian crashes) therefore do not include pedestrian falls in public space, collisions with stationary objects, or injuries sustained without the involvement of a moving vehicle.

Between 2010 and 2019, an annual average of 59 pedestrians were killed as a result of a road crash (source: Statistics Netherlands datalink). It is estimated that the number of pedestrians killed or admitted to hospital and registered as road crashes constitutes a quarter of all pedestrians killed or hospitalised after an accident on a public road (including falls and suchlike) [2]. See Schepers and Methorst [3] for more information about pedestrian falls.

In 1999-2019, fewer and fewer pedestrians were killed in road crashes (see Figure 2). Since 1999, the number of pedestrian road deaths has decreased by 62%. In the last few years, however, the decrease has stagnated.

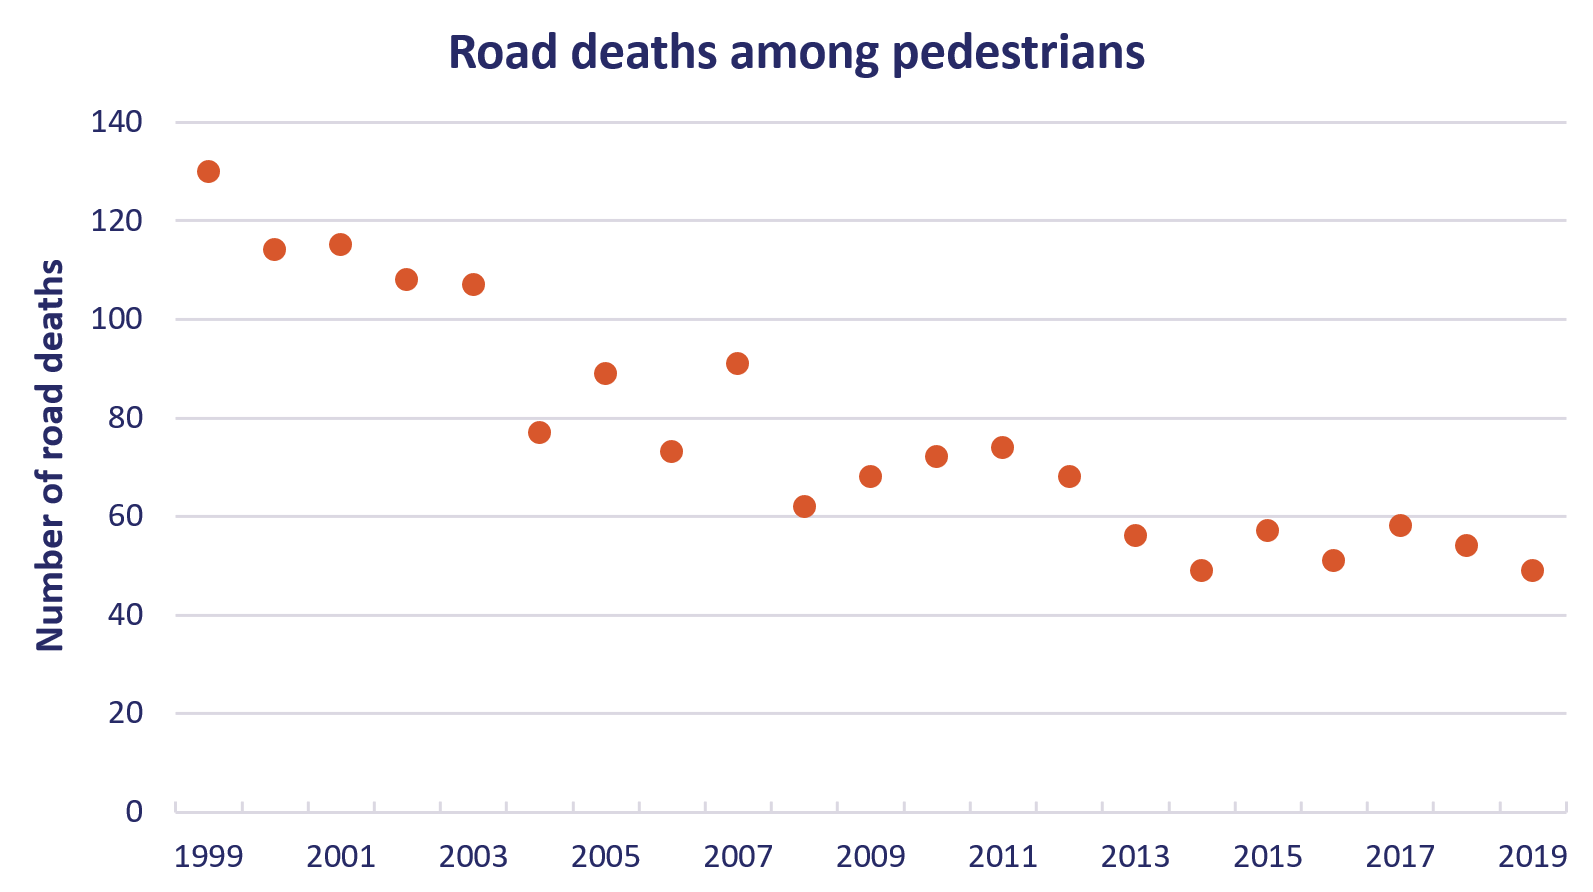
Figure 2. Number of pedestrian road deaths in 1999-2019 (source: Statistics Netherlands datalink).

Over the years, the share of serious road injuries among pedestrians has also decreased. Figure 3 shows the distribution of serious road injuries by mode of transport in 2000-2018.

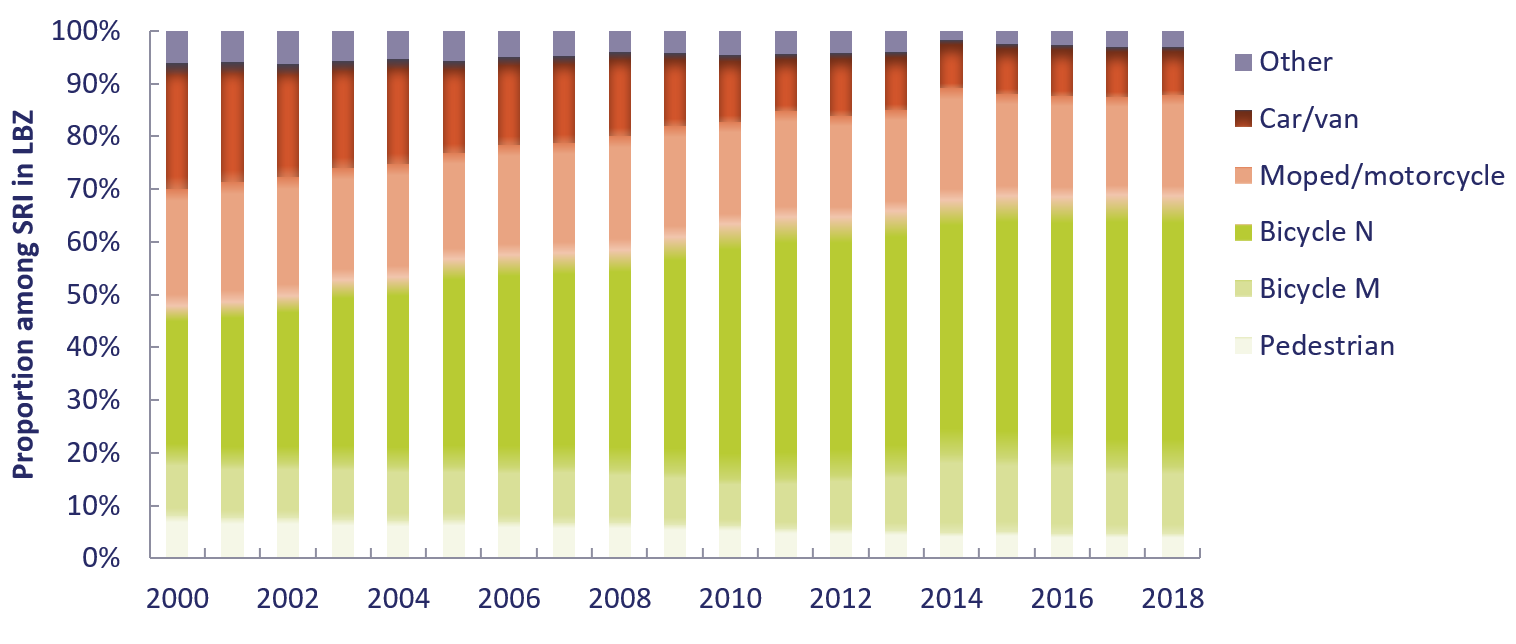
Figure 3. Distribution of serious road injuries in the Netherlands in 2000-2018 by mode of transport, based on the National Hospital Registration, a database managed by Dutch Hospital Data (DHD). For bicycle crashes, a distinction was made between crashes involving a motor vehicle (M) or not involving (N) a motor vehicle. This distinction may not be entirely accurate, since mode of transport is not always accurately registered in the National Hospital Registration (source: DHD en SWOV).

Is walking safer or less safe than other modes of transport?

In Figure 4, the number of road deaths of five modes of transport is divided by the estimated distance travelled (source: Statistics Netherlands). The fatality rate of pedestrians and cyclists has been similar since 2008, the fatality rate of (light) moped riders or motor cyclists is 3 to 4 times higher, while the fatality rate of drivers is 7 to 8 times lower (source: Statistics Netherlands, SWOV). In Figure 4, five-year averages are presented, since annual averages would be more coincidental on account of uncertainties in mobility data and fatality numbers. The figure also shows that, for all modes of transport, the fatality rate has decreased since the start of this century.

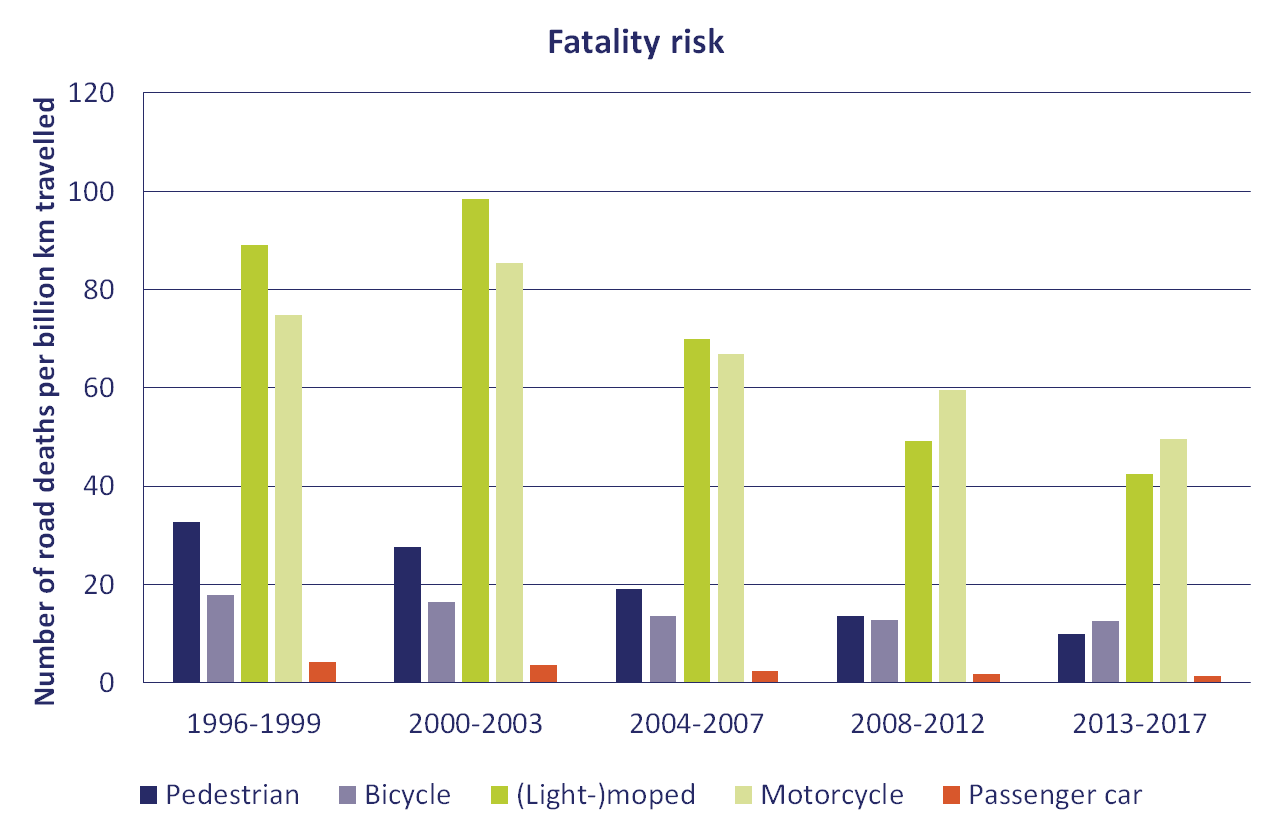
Figure 4. Fatality rate (number of road deaths per distance travelled) in the Netherlands for five different modes of transport, averaged over five-year periods (sources: Statistics Netherlands, Ministry of Infrastructure and Water Management (IenW), edited by SWOV).

Where do most casualties among pedestrians occur and which vehicles are their crash opponents?

Most serious road crashes among pedestrians occur in the urban area and with a car as crash opponent. Since 2009, the exact crash locations have only been registered infrequently. In most cases, however, the registration does include whether the crash occurred in or outside the urban area. Figure 5 shows that, in 2009-2018, an average of 32% of pedestrian road deaths and 9.5% of serious pedestrian road injuries occurred outside the urban area.

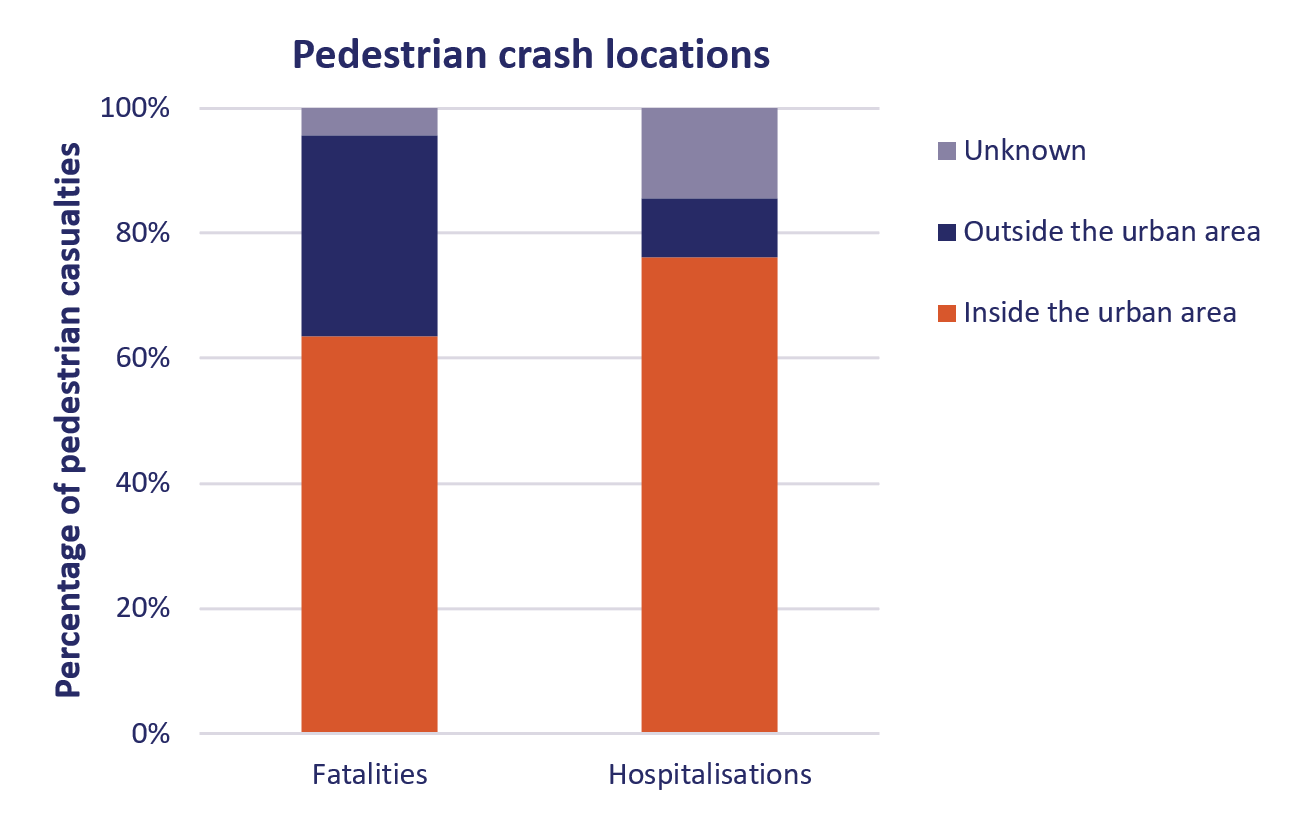
Figure 5. Distribution of pedestrian fatalities and serious injuries, inside or outside the urban area, average percentages in 2009-2018 (source: Statistics Netherlands, SWOV).

Apart from cars, motorised two-wheelers  – (light) mopeds and motorcycles – and delivery vans are the two most common crash opponents of pedestrians in serious road crashes (see Figure 6).

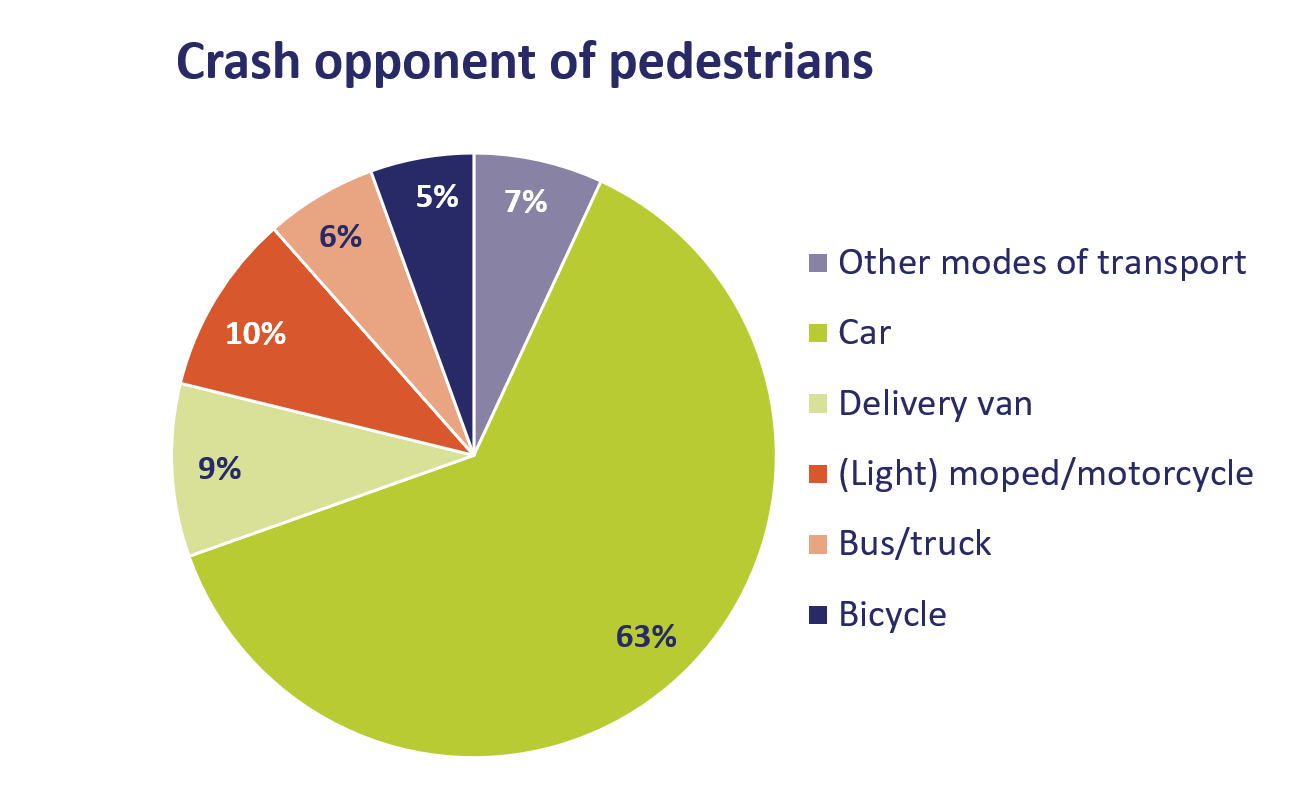
Figure 6. Distribution of killed or seriously injured pedestrians according to crash opponent, average percentages in 2009-2018 (source: Statistics Netherlands, SWOV).

Which pedestrians are most at risk of becoming road crash casualties?

One third of the pedestrians killed in road crashes are aged 75 or over. Other age groups are less vulnerable (see Figure 7).

The greater vulnerability of older pedestrians [4] results in a higher risk of sustaining serious injuries. Growing older increases the chances of impairment. Walking speed, reaction time, peripheral vision and the flexibility of the neck and upper body may all deteriorate. These functional impairments result in a higher risk of crash involvement [4].

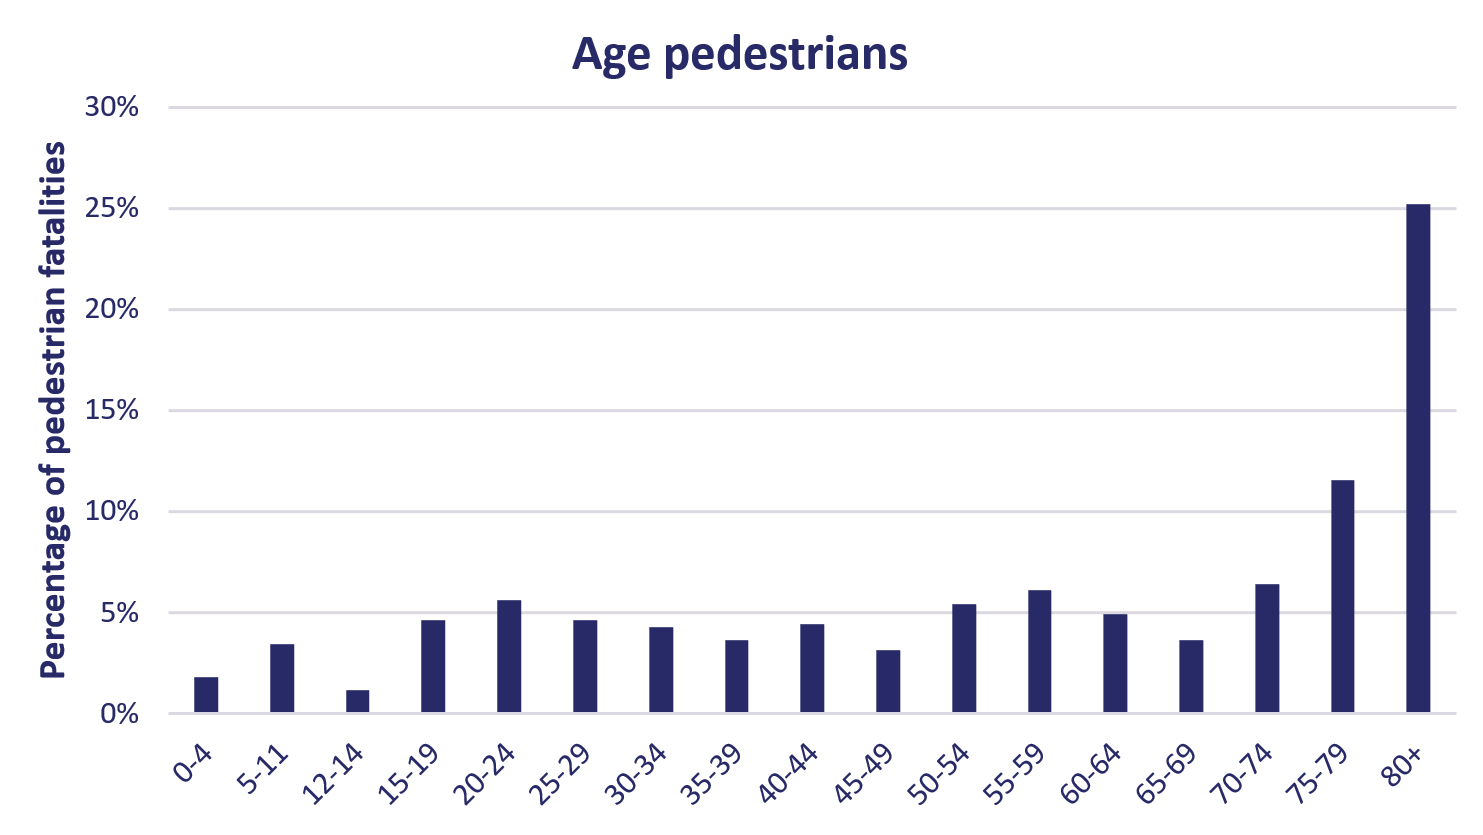
Figure 7. Distribution of pedestrian fatalities according to age group in 2009-2018 (source: Ministry of Infrastructure and Water Management (IenW - BRON).

In traffic, road users with visual or auditory impairments are more vulnerable [4], but their crash involvement is unknown. Their impairment is not registered in the crash register, so we do not know to what degree their vulnerability contributes to their crash rate.

What factors are most important in crashes among (older) pedestrians?

Important factors in pedestrian crashes are the speed of cars, pedestrian appraisal of the speed of a car, distraction (mobile phones) and public lighting.

Crash severity depends on the speed of crossing traffic: only at low speeds (30 km/h or lower) will a collision not or hardly result in a fatal outcome for the pedestrian. For more detailed information, see the question What is the correlation between collision speed (of cars) and the pedestrian fatality rate?.

When crossing, it is important that pedestrians should be able to properly judge when an approaching vehicle will reach the crossing. Particularly for older pedestrians, speeds are hard to estimate [5].

There are no figures available as to what degree distraction is a factor in pedestrian road crashes in the Netherlands.  In the United States, the percentage of fatal pedestrian road crashes involving phone use has increased from less than 1% in in 2004 to 3.6% in 2010 [6].

The level of public lighting affects the risk for pedestrians more than for motorised traffic [7] [8]. Research in the Netherlands also proves that public lighting has a stronger protective effect for vulnerable road users (pedestrians, cyclists, moped riders) than for drivers of motor vehicles [9]; also see SWOV fact sheet Public lighting and vehicle lighting.

Older road users                                                                                     

The road safety of older road users is mainly determined by two factors: functional disorders and physical vulnerability.

Growing older is often accompanied by functional impairment such as deterioration of sight, hearing, and responsiveness, problems in distributing attention, and dementia. Particularly the deterioration of motor functions increases crash risk. By and large, the deterioration of motor functions comprises slower movements, a decrease of muscle strength, a decrease of fine motor skills, and an exceptionally strong decrease of the ability to adapt to sudden changes in posture [4]. There are few indications that the deterioration of visual, auditory and cognitive functions accompanying the normal ageing process also has road safety consequences. Only severe sensory, perceptual and cognitive disorders do correlate to crash involvement [4] [10].

Physical vulnerability is caused by, among other things, a decrease of muscle power and flexibility, by balance, and muscle control by the brain. In addition, the normal ageing process of the body may be exacerbated by various diseases or afflictions (and related medication), a poor and unhealthy lifestyle, and too little physical exercise [11].

What is the correlation between collision speed (of cars) and pedestrian fatality rate?

The higher the car speed, the higher the risk of serious injuries or fatalities among pedestrians. The vulnerability of pedestrians is high because their bodies are unproctected [12]. In a collision with a motor vehicle, the collision energy is mostly transferred to the pedestrian’s body. Therefore, the fatality rate is high.  Chances of survival are only reasonably high in collisions at low collision speeds: lower than 30 km/h; see Figure 8 [13].

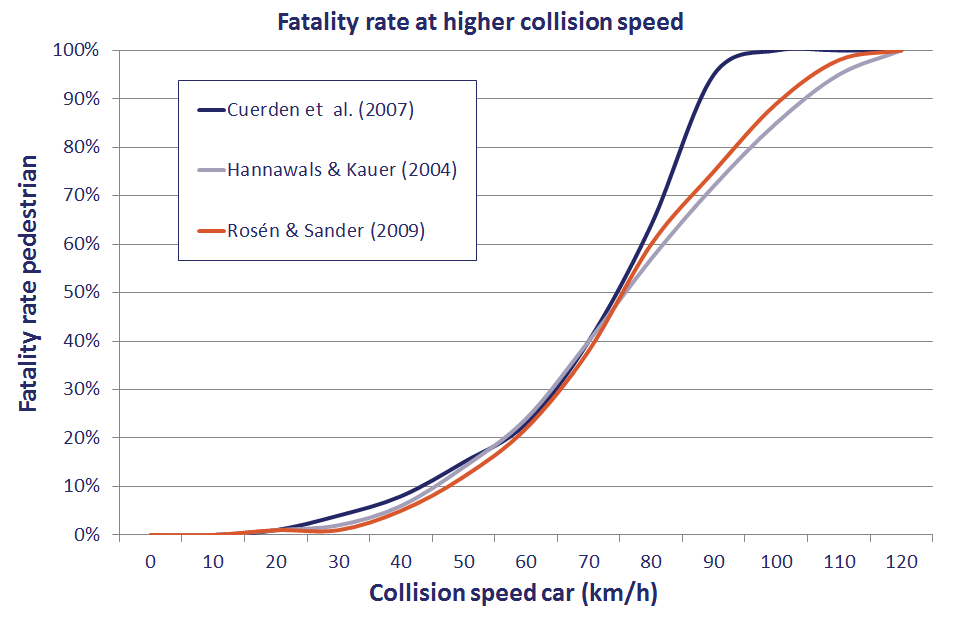
Figure 8. The correlation between collision speed and pedestrian fatality rate in a crash involving a car (source: [13]).

Research shows that motor vehicles exceeding speed limits increase the pedestrian fatality rate. On roads with a speed limit of 15 km/h, the fatality rate is 500% higher for collisions with vehicles driving at a speed of 35 km/h compared to vehicles complying with the speed limit. On a 50 km/h roads, the rate is 325% higher for collisions with vehicles driving at a speed of 70 km/h compared to vehicles complying with the speed limit [14].

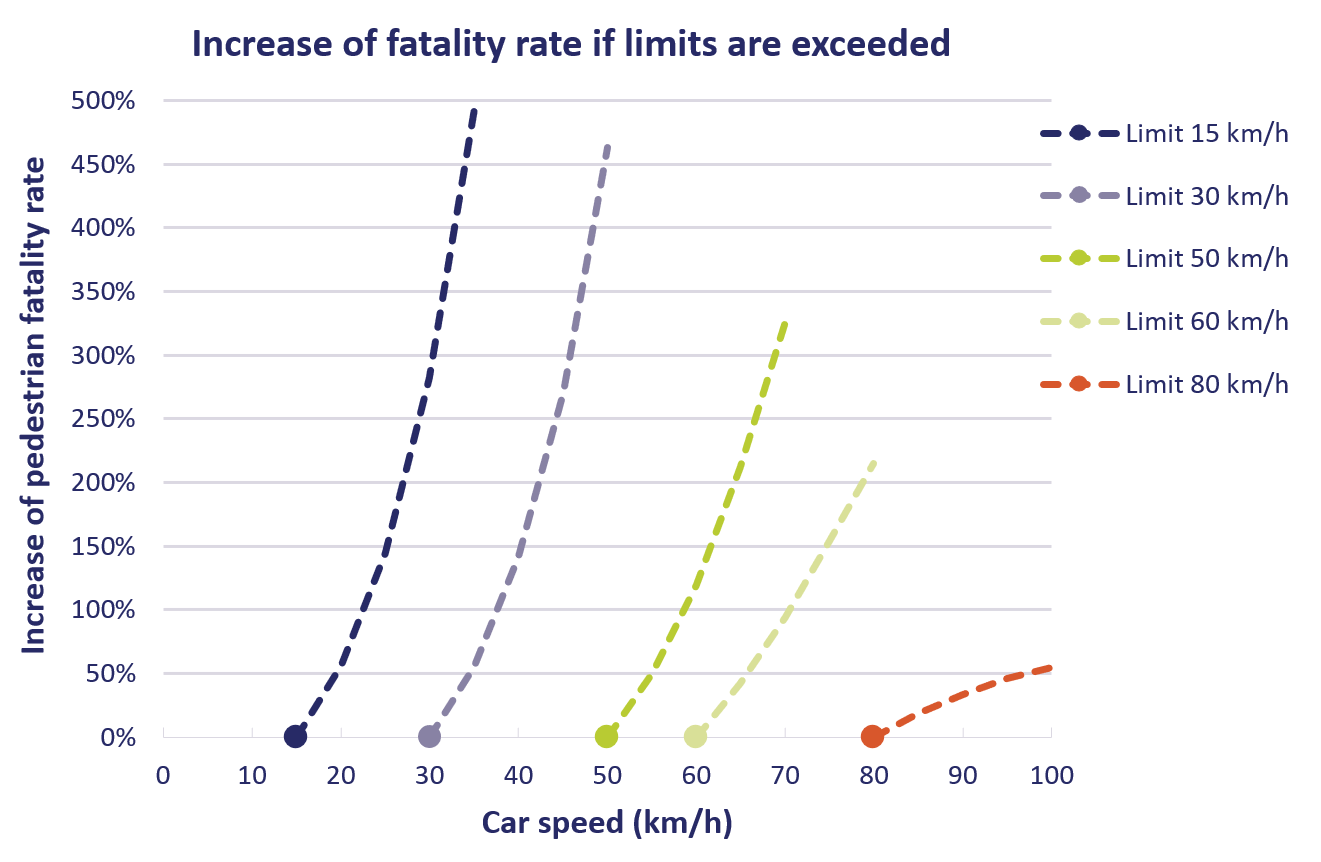
Figure 9. In a collision between a car and pedestrian: increase of pedestrian fatality rate compared to the fatality rate when speed limits are complied with  (source: [14]).

How dangerous is pedestrian red light crossing?

There are no exact data about the crash risk of pedestrian red light crossing. What we do know is that 10% of the registered pedestrian fatalities (in 2015) resulted from red light negation by pedestrians or their crash opponents (SWOV, BRON).

How dangerous is mobile phone use while walking?

In the Netherlands, there are no figures about distraction as a factor in pedestrian crashes. In the United States the percentage of pedestrians killed while using the phone and simultaneously crossing the road has increased from less than 1% in 2004 to 3.6% in 2010 [6].

Which pedestrian provisions are there and how effective are they?

There are four kinds of pedestrian provisions:

  • Provisions that lower the speed of motor vehicles; referring to raised junctions, speed humps, axis offsets and 30 km/h zones.
  • Provisions that separate motor vehicles and pedestrians by time; referring to different kinds of traffic light control.
  • Provisions that separate motor vehicles and pedestrians by place; referring to bridges, tunnels, viaducts, pavements and central islands.
  • Provisions that increase visibility and conspicuousness; referring to lighting, markings, signing, and relocation of lay-bys, bus stops and other sight obstructions.

Not all provisions mentioned above are equally effective. By and large, provisions that lower driving speeds or seperate transport modes by place are most effective [15].

Sustainably safe pedestrian crossings

Requirements for a sustainably safe pedestrian crossing are [16]:

  • traffic calming measures with either horizontal speed reduction such as road narrowing, or vertical speed reduction such as speed humps or raised junctions;
  • zebra marking parallel to the carriageway;
  • zebra marking continuing across parallel bicycle tracks;
  • traffic sign ‘pedestrian crossing' (L2) at some distance prior to the zebra crossing;
  • illuminated L2 sign above the zebra crossing, on a gantry;
  • appropriate lighting, preferably in a contrasting colour;
  • profiled paving of the pedestrian route towards the zebra crossing;
  • studded paving at the start and end of the zebra crossing, and sloping access curbing if the zebra is not on a raised junction;
  • minimal zebra width is 4 metres;
  • minimal crossover length, possibly with refuge.

A sustainably safe pedestrian crossing should only be constructed for urban area distributor roads that have a 50 km/h speed limit, physical separation of driving directions and a single lane for each driving direction (see SWOV fact sheet Principles for safe road design ). The most fundamental requirement is physical speed reduction; a motor vehicle must only ever approach a pedestrian crossing at a maximum speed of 30 km/h.

How safe are zebra crossings for pedestrians?

About the use of the present crossing facilities in the Netherlands (among which zebra crossings) not much is known. Crash statistics do not explicitly include quantitative data about the use of crossing facilities nor about crossing conflicts with this description. Crash studies of crossing facilities are rather rare and dated.

Crash studies

In the eighties, extensive experiments with different types of pedestrian crossing facilities at road sections and arterial road intersections were conducted in the Netherlands. Evaluation of some of these facilities showed a slight decrease in the number of crashes involving pedestrians at intersection crossings – in spite of an overall increase in the number of crashes involving pedestrians (Bos & Dijkstra, in [17]).

Foreign research found contradictory results. In the United Kingdom, research showed that crossing facilities appeared to have a positive effect on road safety [18]. In the United States, however, research shows that when the volume of cars amounts to 10,000 cars a day, the pedestrian crash rate (the number of crashes involving pedestrians divided by the number of crossing pedestrians) at locations with crossing facilities was higher than at locations without markings. With fewer cars, locations with crossing faccilities were just as safe as those without markings [19].

Other kinds of studies

Apart from crash studies, there are also studies that estimate the lack of safety on the basis of observation (mostly using video registration) of crossing behaviour. These foreign studies show conflicting results. Fu and colleagues [20] found that crossing facilities resulted in less safe pedestrian behaviour, while Pulugurtha and colleagues [21] concluded that at crossing facilities, pedestrians and crossing traffic did display safe behaviour. De Langen [22] concluded that at pedestrian crossings designed according to the principles of Sustainable Safety, where lower car speeds are customary, pedestrians felt less safe than at ordinary pedestrian crossings.

Is a design based on Shared Space safe for pedestrians?

So far, it has not been scientifically determined whether a Shared Space design results in more safety than a ‘traditional’ design. Such an evaluation is needed before widespread introduction is justifiable [12].

In the late nineties, the idea of  Shared Space emerged as a response to the extensive regulation of road traffic (numerous signs and marking) [23]. This approach intends to create a public space which should tempt road users to behave safely towards each other, not by regulating traffic by traditional traffic measures, but by grouping road users together in one space.

What measures may contribute to pedestrian safety?

Possible measures and measures already applied may be classified as infrastructural measures, vehicle technology measures, and behavioural measures.

Infrastructural measures

Pedestrian crossings should be clearly visible (lighting), recognisable and uniform. Taking into account the specific impairments of older pedestrians, the following measures at pedestrian crossings are possible:

  • diminishing the crossing distance by refuges or by extending the pavement;
  • supplying more pedestrian crossings with traffic lights;
  • setting traffic light intervals to accommodate walking speed of older pedestrians;
  • in crowded pedestrian areas: reducing the speed of other traffic by installing elevations (raised junctions) or by completely excluding motorised traffic.

There are a number of initiatives to increase road safety on school routes and other routes frequently used by young pedestrians (see [24] for example). One of them is the so-called safe wave. A ‘safe wave’ is a designated corridor to take children to schools, playgrounds and sports facilities safely, using recognisable pavement markings and signs [25].

Behavioural observation (speed differences and conflicts) by Dutch Fietsberaad [26] and German FGSV [27] implies that cycling in pedestrian areas is safe and practicable, provided the number of pedestrians does not exceed 100 per hour for a profile width of one metre. At 100-200 pedestrians per hour for a profile width of one metre, a ‘segmented profile’ (with a separate cycling strip) is advisable, while at more than 200 pedestrians, joint use of the area is unadvisable. For cyclists, no critical threshold has been determined, although in practice the number of cyclists per hour does not exceed 600.

For more information, see SWOV fact sheet Infrastructure for pedestrians and cyclists.

Vehicle technology

A pedestrian-friendly car front is a frontal construction without any sharp and hard/stiff components, so that, in case of a collision, (serious) injuries of pedestrians are minimised. The frontal construction refers to the entire front of the motor vehicle, and therefore includes the bonnet. Decades of research into the protection of pedestrians resulted in the 1995 European requirements for cars. Since 2015, all new cars have had to be fitted with a pedestrian-friendly front. Opinions about the effect of the measure are rather disparate: the industry expects the measure to have hardly any effect; European Transport Safety Council ETSC expects enormous casualty reductions [28]. It should be noted that implementation of a pedestrian-friendly car front is based on a collision speed maximum of about 30 km/h.

Volvo and Mercedes Benz have chosen a different angle. A in-vehicle radar system and camera detect an approaching pedestrian. The vehicle warns the driver and proceeds to brake automatically.

Side shields for trucks, another vehicle measure, also enhance pedestrian safety. Since 1 January 1995, all new trucks and (semi)trailers have had to be fitted with side shields. For road users such as pedestrians, closed side shields of trucks are more effective in reducing injury severity than open side shields [29]. For more information, see SWOV fact sheet Trucks and delivery vans.

Speed reduction which could be achieved by speed limiters also enhances road safety. Particularly in the urban area, Intelligent Speed Assistance (ISA) could effectively contribute to the safety of pedestrians and cyclists by limiting the speed of high/speed traffic to a safe 30 km/h. However, it will take some time before ISA is introduced. Also see SWOV fact sheet Speed and speed management.

Behavioural measures

Since cars are the most common crash opponents of pedestrians, much may be gained by educating aspiring drivers to make sure they develop appropriate behaviour during driver training. The ‘Regulation concerning driving test requirements’ includes the requirement that, during the driving test, the participant should drive safely near and on specific road sections, such as access roads, entries and exits, pedestrian crossings, and tram and bus stops. The participant should also demonstrate insight into the associated actions and manoeuvres by a permanent awareness of (possible) other road users, particularly vulnerable road users such as pedestrians and cyclists.

In the Netherlands, crossing guards have helped children to cross roads to and from school since 1947; see ‘Regulation crossing guards’’ for more information about legislation concerning crossing guards. Drivers are obliged to stop when crossing guards signal them to do so. In recent years, the number of volunteers has decreased and training crossing guards does not seem to be a police priority. The Crossing Guard Foundation also receives more and more signals that not all crossing guards have undergone training. The Dutch Traffic Safety Association intends to enhance services for crossing guards, so that they will receive the supervision and support needed to carry out their voluntary work properly [30].

Wegman & Aarts [31] also indicate that, in addition to formal education, parents and caretakers could also contribute to the traffic education of children. It appears that, at present, only a minor role is reserved for this informal education [32].

Publications and sources

Below you will find the list of references that are used in this fact sheet. All sources used can be consulted or retrieved via our Library portal. Here you can also find more literature on this subject

[1]. SWOV (2020). Passenger kilometers CBS/OVIN adjusted for holiday traffic. . SWOV Facts and figures, Safety figures, Risk, the Hague. Retrieved on 3-08-2020 at https://theseus.swov.nl/single/?appid=01d55f13-2ae6-4c76-a4fe-c9f9051875cb&sheet=3062679e-9623-456e-a7b6-480ad73792a8&opt=currsel%2Cctxmenu.

[2]. Methorst, R., Essen, M. van, Ormel, W. & Schepers, P. (2010). Letselongevallen van voetgangers en fietsers. Een verrassend beeld!. Rijkswaterstaat, Delft.

[3]. Schepers, J.P. & Methorst, R. (2020). Voetgangersveiligheid. Verkenning van onveiligheid, oorzaken en beleidsmogelijkheden [Pedestrian safety. Exploration of the level of unsafety, its causes and policy options]. R-2020-4 [Summary in English]. SWOV, Den Haag.

[4]. Davidse, R.J. (2007). Assisting the older driver: Intersection design and in-car devices to improve the safety of the older driver. SWOV-Dissertatiereeks. Proefschrift Rijksuniversiteit Groningen RUG, Groningen.

[5]. Kuiken, M.J. & Spapé, I. (2006). Over oversteken. Theorie en aanknopingspunten voor een actieprogramma voor kwetsbare verkeersdeelnemers gericht op oversteken. Rijkswaterstaat Dienst Verkeer en Scheepvaart, Rotterdam.

[6]. Fisher, P. (2015). Everyone walks. Understanding & addressing pedestrian safety. Governors Highway Safety Association, Washington.

[7]. Elvik, R., Høye, A., Vaa, T. & Sørensen, M. (2009). The handbook of road safety measures. Second edition. Emerald, UK.

[8]. Elvik, R. (1995). Meta-analysis of evaluations of public lighting as accident counter measure. In: Transportation Research Record, vol. 1485, p. 112-123.

[9]. Wanvik, P.O. (2009). Effects of road lighting: An analysis based on Dutch accident statistics 1987-2006. In: Accident Analysis & Prevention, vol. 41, nr. 1, p. 123-128.

[10]. Brouwer, W.H. & Davidse, R.J. (2002). Oudere verkeersdeelnemers. In: Schroots, J.J.F. (red.), Handboek psychologie van de volwassen ontwikkeling en veroudering. Van Grocum, Assen, p. 505-531.

[11]. Oxley, J., Corben, B., Fildes, B., O'Hare, M., et al. (2004). Older vulnerable road users. Measures to reduce crash and injury risk. MUARC Report No. 218. Monash University Accident Research Centre MUARC, Clayton, Australia.

[12]. Aarts, L.T. & Dijkstra, A. (2018). Achtergronden en uitwerking van de verkeersveiligheidsvisie. De visie Duurzaam Veilig Wegverkeer voor de periode 2018 – 2030 onderbouwd [Sustainable Safety version 3 – Backgrounds and elaboration of the updated road safety vision. Substantiation of the second advanced Sustainable Safety vision for the period 2018-2030]. R-2018-6B [Summary in English] SWOV, Den Haag.

[13]. Rosén, E., Stigson, H. & Sander, U. (2011). Literature review of pedestrian fatality risk as a function of car impact speed. In: Accident Analysis & Prevention, vol. 43, nr. 1, p. 25-33.

[14]. Temürhan, M. (2016). Berekening risicotoename bij overschrijding van de snelheidslimiet [Calculating the increase in fatality risk when exceeding the speed limit]. R-2016-19. [Summary in English]. SWOV, Den Haag.

[15]. Retting, R.A., Ferguson, S.A. & Hakkert, A.S. (2003). Effects of red light cameras on violations and crashes: a review of the international literature. In: Traffic Injury Prevention, vol. 4, nr. 1, p. 17-23.

[16]. CROW (2006). Veilig oversteken? Vanzelfsprekend! Publicatie 226. CROW, Ede.

[17]. Dijkstra, A. (2000). Veiligheidsaspecten van verkeersvoorzieningen in stedelijke gebieden [Safety aspects of traffic facilities in urban areas]. R-2000-5. [Summary in English]. SWOV, Leidschendam.

[18]. Ward, H., Cave, J., Morrison, A., Allsop, R., et al. (1994). Pedestrian activity and accident risk. AA Foundation for Road Safety Research, Basingstoke, Hampshire.

[19]. Zegeer, C.V., Richard, S.J., Huang, H. & Lagerwey, P. (2001). Safety effects of marked versus unmarked crosswalks at uncontrolled locations: Analysis of pedestrian crashes in 30 cities. In: Transportation Research Record, vol. 1773, nr. 1, p. 56-68.

[20]. Fu, T., Miranda-Moreno, L. & Saunier, N. (2018). A novel framework to evaluate pedestrian safety at non-signalized locations. In: Accident Analysis & Prevention, vol. 111, p. 23-33.

[21]. Pulugurtha, S.S., Vasudevan, V., Nambisan, S.S. & Dangeti, M.R. (2012). Evaluating effectiveness of infrastructure-based countermeasures for pedestrian safety. In: Transportation Research Record, vol. 2299, nr. 1, p. 100-109.

[22]. Langen, A.C.B. de (2003). Veiligheid van enkele typen oversteekvoorzieningen in stedelijke gebieden. Analyse van ongevallengegevens en gedragswaarnemingen [The safety of various types of urban crossing facilities. Accident analysis and behaviour observations].. R-2003-23.[Summary in English]. SWOV, Leidschendam.

[23]. Hamilton-Baillie, B. (2008). Shared Space. Final evaluation and results. Keuninginstituut, Provincie Friesland, Leeuwarden.

[24]. Rijk, A. (2008). Verkeersveiligheid van kinderen. Een ongevallenanalyse en literatuurstudie [The road safety of children. A crash analysis and literature study]. R-2008-6. [Summary in English]. SWOV, Leidschendam.

[25]. Jager, D. de, Torenstra, J., Haas, J. de & Spapé, I. (2006). Veilige kindcorridor in steden; Kindlint zet dit jaar eerste stapjes in Amsterdam en Delft. In: Verkeerskunde, vol. 57, nr. 4, p. 34-39.

[26]. Godefrooij, H., Hal, E. van & Temme, R. (2005). Fietsers in voetgangersgebieden. Feiten en richtlijnen. Publicatienummer 8. Fietsberaad, Ede.

[27]. FGSV (2010). Empfehlungen für Radverkehrsanlagen ERA. Forschungsgesellschaft für Straßen- und Verkehrswesen FGSV, Köln.

[28]. ETSC (2001). Priorities for EU motor vehicle safety design. European Transport Safety Council ETSC, Brussel.

[29]. Kampen, L.T.B. van & Schoon, C.C. (1999). De veiligheid van vrachtauto's. Een ongevals- en maatregelenanalyse in opdracht van Transport en Logistiek Nederland [The safety of lorries. An accident and measures analysis commissioned by the Dutch Transport Operators Association]. R-99-31. [Summary in English]. SWOV, Leidschendam.

[30]. Verkeersnet (2013). Verkeersbrigadiers naar VVN. Verkeersnet. Retrieved on 28-11-2019 at https://www.verkeersnet.nl/verkeerseducatie/10055/verkeersbrigadiers-vvn/.

[31]. Wegman, F. & Aarts, L. (2005). Denkend over Duurzaam Veilig. SWOV, Leidschendam.

[32]. Hoekstra, A.T.G. & Mesken, J. (2010). De rol van ouders bij informele verkeerseducatie. Vragenlijststudie naar kennis, behoeften en motieven van ouders [The role of parents in informal traffic education. Questionnaire study of parents' knowledge, needs and motivation]. R-2010-31. [Summary in English]. SWOV, Leidschendam.

2 + 3 =
Solve this simple math problem and enter the result. E.g. for 1+3, enter 4.

Would you like to cite this fact sheet?

SWOV publication

This is a publication by SWOV, or that SWOV has contributed to.