Risky road user behaviour, aggression and repeat offenders

Updated

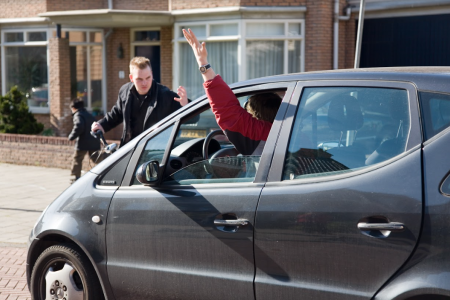
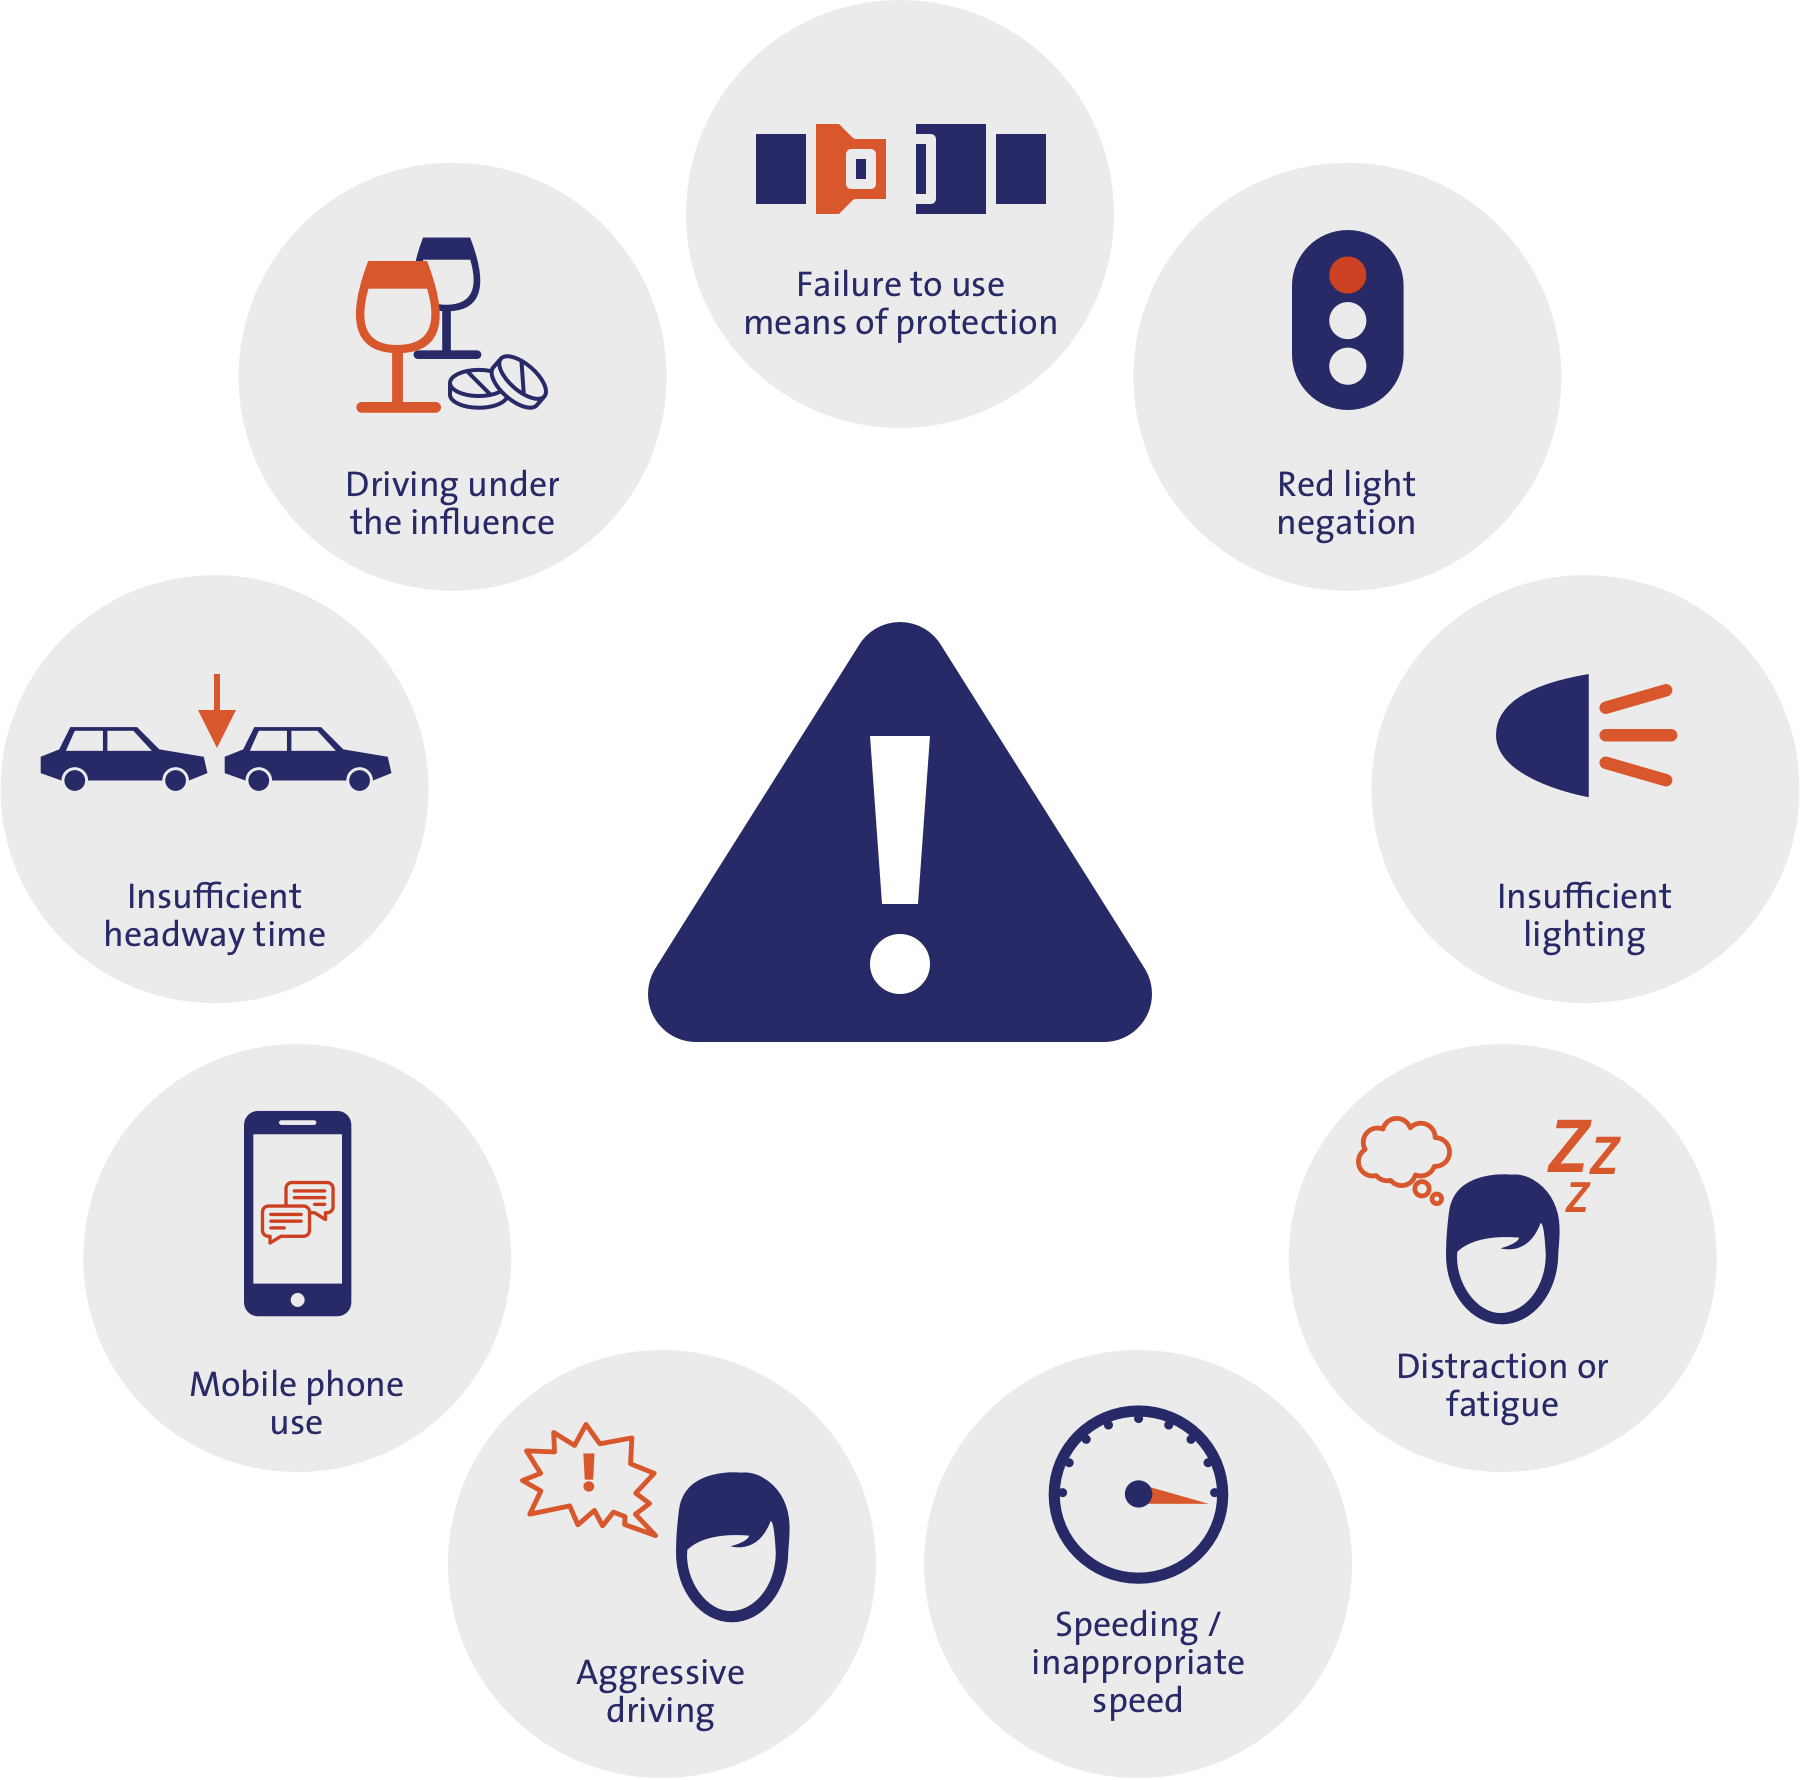
Risky road user behaviour is behaviour that adversely affects road safety, such as driving under the influence of alcohol, drugs or medicines, speeding, inappropriate speed, distracted or fatigued driving, red light negation, and failure to use or misuse means of protection (motorcycle or moped helmet, seatbelt). Younger road users more often display risky behaviour than older road users, and men more often than women. Aggressive behaviour is a specific form of risky road user behaviour, which aims to harm other road users physically or emotionally, for example by tailgating, excessive horn honking, flashing one’s lights, yelling and/or making obscene gestures. Aggressive road user behaviour often stems from impatience, frustration, animosity and/or hurrying, and often goes hand in hand with anger. People who generally tend to get angry quickly, also display aggressive road user behaviour more often. A different form of risky road user behaviour is repeat offending. The ‘repeat offender scheme’ defines repeat offenders as road users who commit at least three serious traffic offences within two years. The commission of multiple minor offences is also relevant, as this seems to be associated with greater crash involvement.

Effective measures to prevent risky behaviour are, a.o. targeted enforcement, devices to minimise specific road user behaviour (such as an alcohol lock or intelligent speed assistance) and data recorders to monitor road user behaviour. In addition, aggressive road users can learn to reduce their anger behind the wheel by means of psychotherapy programmes. Sending letters that tell road users they are registered as repeat offenders, and having personal conversations about their road user behaviour are examples of specific supplementary measures aimed at repeat offenders.

What do we mean by risky road user behaviour?

Risky road user behaviour is behaviour that adversely affects road safety. Behaviour that can scientifically be proven to adversely affect road safety is: driving under the influence of alcohol, drugs or medicines, speeding, inappropriate speed, fatigue, distraction (e.g. mobile phone use), red light negation, insufficient headway time, not using lights (by cyclists in particular), and failure to use or misuse means of protection such as motorcycle or moped helmets, or seatbelts [1]. Risky driving behaviour often goes hand in hand with the tendency to get angry behind the wheel [2]. Particularly in young drivers, anger while driving is a predictor of risky road user behaviour [2].

Specific forms of risky road user behaviour are aggression (also see the question What do we mean by road user aggression?) and the commission of multiple traffic offences by repeat offenders (also see the question What do we mean by repeat offenders or ‘traffic hooligans’?).

What do we mean by road user aggression?

Road user aggression or aggressive road user behaviour is deliberate behaviour aimed at harming other road users physically or emotionally [3]. Examples of aggressive road user behaviour are tailgating, excessive horn honking, flashing one’s lights, yelling or making obscene gestures. The term ‘road rage’ is also often used, but its usage by different researchers is rather inconsistent and often hard to distinguish from the more general concept of ‘aggressive road user behaviour’ [3]; Galovski et al. (2006) as mentioned in [4]. Traffic disputes in which road users call one another names, lash out, run someone over, cut off someone, or even take shots at one another, may all be considered as manifestations of road rage.

What causes road user aggression?

Animosity, impatience and/or being in a hurry, are often motives for road user aggression [5]. Aggressive road user behaviour is mostly caused by annoyance with others and irritation about situations [6] [7] [8]. According to the Dutch National Driver Survey, the top ten grievances in 2019 were as follows [9]:

  1. Tailgating
  2. Aggressive driving
  3. Drug- and/or drink-driving
  4. Failure to indicate direction
  5. Driving on the left without need
  6. Speeding in an urban area
  7. Last-minute lane merging
  8. Overtaking on the right
  9. Sunday drivers
  10. Speed humps

The behaviour of (Light) moped riders and cyclists may also give rise to irritation. A survey in Amsterdam proved that half the respondents were annoyed by the behaviour of (light) moped riders [10]. A quarter of them were annoyed by cyclists. Respondents that do not or hardly cycle themselves were particularly annoyed by cyclists’ red light negation (45%), cycling on the pavement (35%), cycling without lights (25%), not indicating direction (24%) and not paying attention while cycling (23%) [10]. Cyclists themselves are mainly annoyed by scooters and (light) mopeds (56%), by other cyclists’ lack of attention (31%), red light negation (24%) and wrong-way cycling (23%).

Road user aggression often goes hand in hand with ‘anger’ [7] [11] [12] [13]. A road user’s anger may stem from personal characteristics or from the traffic situation. People differ in the extent to which they tend to react emotionally; this is true in traffic as well. People who generally tend to react angrily or aggressively, not only report anger but also worse anger when participating in traffic [11] [12]. Emotions may have arisen before or may arise during traffic participation [7].

In addition, anger is often a reaction to frustration attributed to someone else [6]. Frustration during traffic participation may arise when self-interest is hampered, for example by congestion, long waits at red lights or by offences or unexpected behaviour of other road users [6] [7]. Anonymity and lack of direct communication possibilities further contribute to the risk of driver aggression [14] [15].

Among cyclists, anger during traffic participation also occurs, but online questionnaire replies suggest that cyclists usually deal with their anger constructively; they accept their anger and do not let their frustration mount [16]. Aggressive reactions (verbal, physical) are more common among young cyclists, among men, and among frequent cyclists [16].

How common is road user aggression?

Cases of road user aggression are not officially registered, nor the number of road casualties that ensue. So its prevalence cannot be established. Survey results are available however. The Safety Monitor of Statistics Netherlands is a recurrent large-scale population survey among 135,000 inhabitants aged 15 or over, asking about aggressive road user behaviour in their neighbourhoods [17]. In 2019, 29.3% replied that aggressive road user behaviour does sometimes occur in their neighbourhoods and 6.3% even replied that they experience quite some nuisance from aggressive road user behaviour [17]. In 2017, these percentages were almost the same (29.6% en 6.2%).

An online survey among over 25,000 members of the ‘EenVandaag Opiniepanel’ (online opinion panel of tv news programme) showed that, by their own account, one in eight drivers was involved in a ‘traffic dispute’ sometime in 2019 [18]. Half of these disputes (52%) resulted in a dangerous situation, such as drivers making each other brake abruptly in dense traffic, consciously driving others off the road or trying to do so, or fighting in the streets. In said survey, more than a quarter (27%) of cyclists reported having been involved in a traffic dispute at one time or another.

Traffic disputes are reported to the police more and more often. Between 2013 and 2018, the number of reported traffic disputes in the Netherlands doubled from 3140 in 2013 to 6340 in 2018 [19]. In 2018, police had to deal with violence in traffic 824 times, 300 times more often than in 2017 [19].

What do we mean by repeat offenders or ‘traffic hooligans’?

In the most well-known Dutch dictionary ‘de Dikke van Dale’ [20] a traffic hooligan is described as: “someone who behaves like a jerk towards other road users (for example by tailgating and cutting others off) and therefore constitutes a road hazard.” The police define a traffic hooligan as: “someone who disregards other road users, and who fails to comply with traffic regulations and does so consistently.” [21].

Traffic hooligan or road rager are words that are used in the streets, in policy communities and politics, and words that specifically hint at moral disapproval of those who display this kind of road user behaviour. SWOV prefers using the concept of ‘repeat offender’ which is a more neutral concept that focuses on the number of offences and does not pass judgement on the road user’s underlying intention or mindset [22]. The ‘repeat offender scheme’ defines repeat offenders as road users who commit at least three serious traffic offences - so-called traffic hooligan acts – within two years [23] [24]. Examples of ‘traffic hooligan acts’ are not stopping at a stop sign, using a red-cross lane, overtaking near a pedestrian crossing, or turning around or reversing on a motorway. On 1 January 1915, these traffic offences were transferred to criminal justice law to raise the profile of this group of repeat offenders for the judicial authorities (within criminal law, recidivism can be registered) and to be tougher on repeat offenders [25].

In the Netherlands, not much is known about the number of repeat offenders committing serious traffic offences. Nor are figures published about the annual number of road users covered by the ‘repeat offender scheme’ or other such schemes.

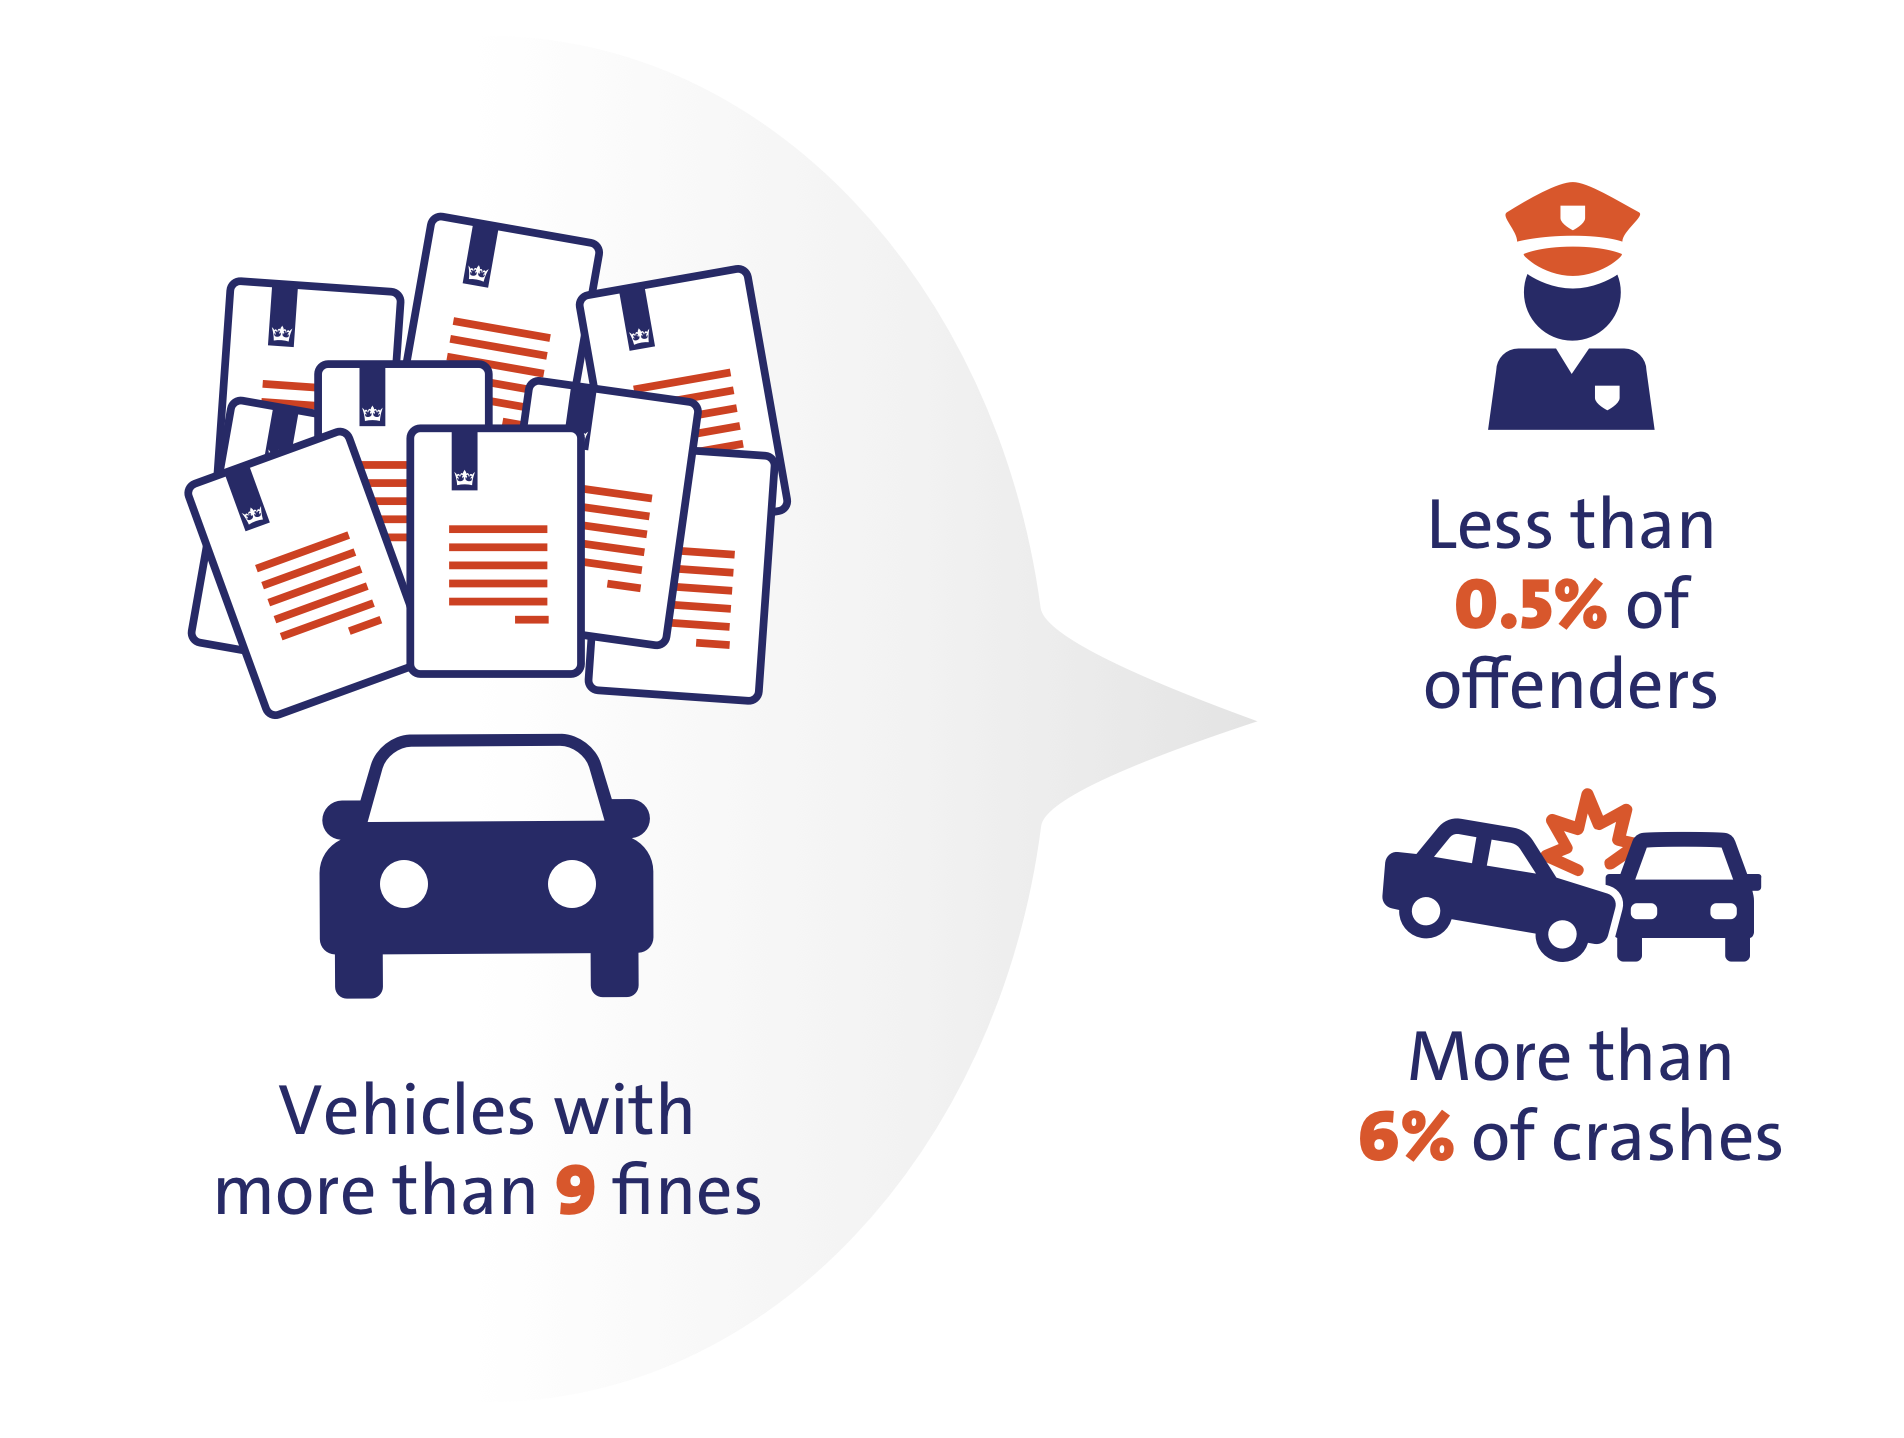
For road safety, the commission of multiple minor traffic offences is also relevant. An analysis of fines by licence plate number showed a negative correlation with crashes. Vehicles with nine or more fines a year constituted less than 0.5% of the offender population. Yet, these vehicles were involved in over 6% of registered road crashes [26].

How many crashes are caused by risky road user behaviour?

How many crashes are caused by risky road user behaviour is unknown. For road crashes, police do not register whether they involved risky road user behaviour. Yet, something can be said about risk increases associated with specific risky behaviour.

For risky road user behaviour prioritised by enforcement, such as drink-driving, speeding and distracted driving, information about the risk of road deaths or crashes is available. It is estimated that 12% to 23% of Dutch road deaths are caused by drink-driving (see SWOV fact sheet Driving under the influence of alcohol). International research shows that about one third of fatal crashes is related to speeding (above the limit) or inappropriate speed (unadapted to the prevailing conditions); see SWOV fact sheet Speed and speed management. There are no recent Dutch estimates of the number of crashes caused by distraction. American 2017 crash figures show that distraction is involved in 9% of registered fatal car crashes and that 6% of drivers involved in a fatal crash were distracted [27] (see SWOV fact sheet Distraction in traffic). Driver fatigue, although not an enforcement priority, is involved in 15 to 20% of crashes (see SWOV fact sheet Fatigue).

Less is known about the effect of other risky road user behaviour (red light negation, cycling without lights, insufficient headway time) on the number of crashes, but there is some knowledge about risk increasing factors and what part they play in specific types of crashes. Studying fatal crashes at signalised 50km/h-intersections shows that in 41 to 67% of these crashes red light negation certainly or possibly played a part [28]. Furthermore, red light negation is estimated to increase crashes of this type 14 times [28]. In the dark, not having or not using front and rear bicycle lights increases the risk of getting involved in a bicycle crash by an estimated 17% [29]. However, the researchers note that the uncertainty of the estimates is significant. Moreover, the quality of the bicycle lights was not taken into account either (the results relate to bicycle lights common between 2002 to 2010). Also see SWOV fact sheet Public lighting and vehicle lighting.

In the United States, it was previously estimated that over 50% of fatal crashes were possibly related to risky (or aggressive) behaviour [30] including speed violations, too short headway times, giving right of way, incorrect overtaking, but also to omitting to indicate direction, or sudden speed changes.

For research purposes, information about repeat offences is only available at vehicle level (the actual operator of the vehicle is unknown). Goldenbeld et al. [26] found that the group of vehicles involved in nine or more offences a year, is involved in over 6% of crashes, while this group constitutes less than 0.5% of the offender population.

Are some types of road users more inclined to risky behaviour than others?

In traffic, different types of road users – drivers, (light) moped riders and cyclists – frequently engage in risky behaviour. It is hard to determine objectively whether some groups of road users are more inclined to this behaviour than other groups.

By their own account, drivers report multiple offences concerning speeding and handheld smartphone use [31]. Motorcyclists and (light) moped riders also report speeding as a frequent offence. By their own account, cyclists are mainly guilty of offences such handheld smartphone use [32] or cycling after consumption of (possibly) more alcohol than is legal [31]. Cycling under the influence of alcohol appears to be quite common: during nights out, 44% of the tested cyclists in the cities of Groningen and The Hague were, legally speaking, under the influence of alcohol [33].

Thus, all types of road users sometimes display risky behaviour and there are no objective data that some types of road users do this more often than others. There are, however, indications that people are inclined to attribute negative or antisocial characteristics to road users that (momentarily) have a different road user role than they themselves have. This phenomenon may be explained by the social identity theory [34], which says that someone’s social identity determines who he considers as ‘us’ or ‘them,’ and explains the inclination to attribute positive characteristics to the former group and negative characteristics to the latter. If road users derive their identity from a specific road user role (‘driver’ or ‘cyclist’), the tendency to interpret road user behaviour of other groups more negatively may follow. In Dutch research, Hoekstra et al. [35] found evidence for this theory: road users who mainly identified themselves as ‘drivers’ were more inclined to expect cyclists to violate the rules than to expect other drivers to do so. They were also more inclined to attribute offending behaviour to a cyclist’s personality than to circumstance.

Are some people more inclined to risky road user behaviour than others?

Research shows that young people and men more often display risky road user behaviour than older people and women. This also applies when specifically considering aggressive road user behaviour and repeat offenders. Risky and aggressive road user behaviour are reinforced by specific personality traits (a.o. thrill seeking and tendency to get angry) [36].

Concerning different types of risky road user behaviour – speeding, phone use, not wearing seatbelts, driving under the influence of alcohol, drugs, or certain medicines, or fatigued driving – a self-report study shows that younger drivers are more inclined to this kind of behaviour than older drivers, and men more than women. But the differences between the youngest and oldest age groups (18-24; 25-34 versus 55-64; 65+) are much larger than the differences between genders [31].

Several studies show that aggressive road user behaviour decreases as one grows older, and that it is more common among men than among women [31] [37] [38] [39]. The difference between risky road user behaviour in general and aggressive driving is that aggressive drivers are usually also aggressive when they are not participating in traffic [36].

Moreover, certain personality traits are shown to be related to a greater tendency to risky or aggressive driver behaviour [8] [12] [40] [41] [42] [43]. It concerns those characterised by

The profile of the group of ‘aggressive drivers’ emerging from international research is: often young, often male; easily angry; convinced of their own superior driving skills; thrill seeking [36].

The background of Dutch repeat traffic offenders has not been researched. On the basis of an international survey among 35,000 drivers in 32 countries, Goldenbeld et al. [46] found that different types of repeat traffic offences – alcohol, drug and speed violations – were mainly committed by young male drivers already acquainted with driving under the influence, who found drugs and alcohol acceptable, whose social environment also found drug use in traffic acceptable, and who felt driving at high speed to be a personal necessity.

The foreign literature about repeat traffic offenders is, otherwise, mostly about drink-driving. It shows that serious alcohol offenders and recidivists often have additional personality and/or behavioural problems [47]. Martí-Belda Bertolín et al. [48] found that problematic alcohol consumption, inclination to animosity, and personality traits, such as a high activation level and a serious need for thrills, were related to committing repeat traffic offences.

How effective is legislation and traffic enforcement in preventing risky road user behaviour?

Clear legislation and focused traffic enforcement can, verifiably, reduce speeding, drink- or drug-driving, red light negation, cycling without lights etc. See SWOV fact sheet Traffic enforcement for the estimated reduction in crashes by enforcement of legislation concerning driving under the influence, speeding, distraction and red light negation.

How effective is public service advertising in preventing risky road user behaviour?

Public service advertising as a separate measure usually has little effect on road user behaviour and road safety. Public service advertising campaigns coupled with enforcement (fines and/or rewards) do have positive effects on road user behaviour. This does not imply that public service advertising on road safety may be dispensed with. For, it may lead to increased knowledge and a change in attitude, and it may broaden support for effective but unpopular measures (also see SWOV fact sheet Public service advertising).

How effective are rehabilitation courses (EMG, LEMA and EMA) in preventing risky road user behaviour?

This answer was adjusted in September 2023. 

Evaluations of rehabilitation courses in the Netherlands do not show an effect on preventing recidivism. The WODC Research and Documentation Centre found no effect of EMA, (Educational Measure Alcohol) [49] or LEMA (Light Educational Measure Alcohol) on recidivism (both general traffic offence recidivism and drink-driving recidivism were studied) [50]. Also the Educational Measure Behaviour (Dutch abbreviation (EMG)), imposed on motorists driving faster than 50km/h in urban areas, was not shown to affect the prevention of EMG-related recidivism [51]. These WODC studies were conducted on 2013 data (LEMA) or 2015 data (EMA and EMG). Since then, the design of both measures has been changed, however. This implies that the study results cannot be translated to the current situation on a one-to-one basis.

A survey of international studies into the effects of rehabilitation programmes for offenders showed widely varying effects [52]. Also see SWOV fact sheet Traffic enforcement.

How effective is an alcohol interlock in preventing risky road user behaviour?

An alcohol interlock programme appears to result in less recidivism than a driving disqualification or revocation of the driving licence. This effect is usually only observed during the period the alcohol lock is present. A Dutch recidivism study shows that an alcohol interlock programme can achieve a reduction of 4% (from 8% to 4%) in the probability of being re-apprehended within two years while having drunk too much alcohol [51]. Swedish track records show that the effects of an alcohol interlock programme may also lead to more lasting behavioural changes, if an integral approach is taken in which the cause of the alcohol problem is also tackled and if medical check-ups continue after the removal of the alcohol interlock [53] [54]. Also see SWOV fact sheet Driving under the influence of alcohol.

How effective is a speed limiter or ISA in preventing risky road user behaviour?

Speeding violations can be prevented with intelligent speed assistance (ISA). If all vehicles were equipped with a mandatory, intervening ISA variant, 29% of road crashes would probably be prevented (also see SWOV fact sheet Speed and speed management).

How effective are demerit point systems and progressive penalty systems in preventing risky road user behaviour?

Demerit point systems may improve road safety, but if the probability of detection is small or if it diminishes, the effect will be short-lived. This becomes apparent from a meta-analysis of 24 European and non-European studies [55]. This showed an initial decrease of the number of road crashes, road deaths and road injuries by 15% to 20%, but after a year and a half this decrease was no longer evident.

The road safety effect of progressive (financial) penalties has not been directly researched, neither in the Netherlands nor abroad. A Dutch scenario analysis does show that a progressive penalty system could reduce the annual number of road deaths by 5% [56], also see SWOV fact sheet Progressive penalty systems in traffic.

What is the effect of usage-based vehicle insurance in preventing risky road user behaviour?

When insurers offer discounts on car insurance premiums based on driving style, as monitored by a smartphone app or a system in the car, this may positively affect driver behaviour. This becomes apparent, for example, in a study by Bolderdijk [57]. If young novice drivers maintained appropriate speeds and this was rewarded by a discount on their insurance premiums, while speeding was penalised by increased premiums, fewer speed violations were observed. The study also showed that they reverted to their former behaviour if the reward was discontinued [57]. A simulator study by Dijksterhuis et al. [58] showed that both direct feedback to the driver behind the wheel and later aggregated feedback resulted in fewer speed violations.

Using such monitoring and feedback systems does pose a few problems: driving style monitoring by means of vehicle movements does not clarify who was behind the wheel; monitoring should be designed in such a way as to guarantee driver privacy; and GPS tracking is less accurate than required [59] particularly near high buildings.

Which countermeasures may prevent road user aggression?

An important source of road user aggression is annoyance about traffic conditions (see the question What causes road user aggression? ). The risk of annoyance, and (therefore) road user aggression, may be reduced by (infrastructural) measures that help traffic flow smoothly without impediments or conflicts [6] [7] [60]. An example is the Amsterdam measure to no longer allow light mopeds on the bicycle track [61]. Visible police presence also reduces aggressive road user behaviour [62].

Individually, road user aggression may be reduced by diminishing someone’s tendency to experience anger in traffic. In a review article about possible interventions for anger in traffic, Deffenbacher [8] concludes that promising psychotherapeutic programmes, among which mindfulness training, may reduce anger behind the wheel. It would be useful to ascertain which potentially effective treatment of aggressive (road user) behaviour could be introduced in the Netherlands, for example as part of a community service sentence or alternative sentence.

Which measures are possible to counter repeat offending?

When it comes to multiple offences and the best approach to repeat offenders, a combination of person-oriented measures is needed. On the basis of a literature study, Hoekstra thus concludes [63]; p. 36) “Repeat offenders seem relatively insensitive to simply stricter measures such as fines and licence suspension and more sensitive to a combination of measures, such as a rehab programme coupled with cognitive behavioural therapy, or an Intense Supervision Programme combining multiple measures such as supervision, probationary period, and therapy, or enforced car sale and licence suspension.”

According to Kuiken et al. [64], potentially effective measures specifically aimed at repeat offenders – ‘notorious traffic offenders’- are:

  • Sending a message to notorious offenders that police and public prosecution service have registered them as repeat offenders.
  • Having personal conversations with repeat offenders concerning their road user behaviour.
  • Using extra sanctions: confiscation of the vehicle.
  • Restricting specific driver behaviour by means of in-vehicle devices such as an alcohol lock and ISA.
  • Having an on-board unit monitor driver behaviour of repeat offenders.
Publications and sources

Below you will find the list of references that are used in this fact sheet. All sources used can be consulted or retrieved via our Library portal. Here you can also find more literature on this subject.

[1]. Weijermars, W.A.M., Stipdonk, H.L., Aarts, L.T., Bos, N.M., et al. (2014). Verkeersveiligheidsbalans 2000-2012. Oorzaken en gevolgen van verkeersonveiligheid [Road safety assessment 2000-2012. Causes and consequences of road unsafety]. R-2014-24.[Summary in English]. SWOV, Den Haag.

[2]. Zhang, T. & Chan, A.H.S. (2016). The association between driving anger and driving outcomes: A meta-analysis of evidence from the past twenty years. In: Accident Analysis & Prevention, vol. 90, p. 50-62.

[3]. Dula, C.S. & Geller, E.S. (2003). Risky, aggressive, or emotional driving: Addressing the need for consistent communication in research. In: Journal of Safety Research, vol. 34, nr. 5, p. 559-566.

4]. Craig-Henderson, K.M. (2006). Road rage: When drivers lose it. In: PsycCRITIQUES, vol. 51, nr. 8.

[5]. Tasca, L. (2000). A review of the literature on aggressive driving research. Paper presented at the Aggressive Driving Issues Conference, October 16th to November 30th, 2000, Downsview, Ontario.

[6]. Levelt, P.B.M. (1997). Agressief gedrag in het verkeer. Opvattingen, stand van zaken en aanbevelingen [Aggressive behaviour in traffic]. R-97-45. [Summary in English]. SWOV, Leidschendam.

[7]. Mesken, J. (2006). Determinants and consequences of drivers' emotions.  PhD-thesis Rijksuniversiteit Groningen RUG, SWOV-Dissertatiereeks. SWOV, Leidschendam.

[8]. Deffenbacher, J.L. (2016). A review of interventions for the reduction of driving anger. In: Transportation Research Part F: Traffic Psychology and Behaviour, vol. 42, p. 411-421.

[9]. Lorsheijd, J. (2019). Bumperkleven grootste ergernis in het verkeer. Verkeerskunde. Accessed on 04-09-2020 at www.verkeerskunde.nl/artikel/bumperkleven-grootste-ergernis-in-het-verkeer.

[10]. Greven, J. & Bosveld, W. (2013). Fietsergernissen. Omnibus 91. Gemeente Amsterdam, Bureau Onderzoek en Statistiek Amsterdam.

[11]. Deffenbacher, J.L., Stephens, A.N. & Sullman, M.J.M. (2016). Driving anger as a psychological construct: Twenty years of research using the Driving Anger Scale. In: Transportation Research Part F: Traffic Psychology and Behaviour, vol. 42, p. 236-247.

[12]. Deffenbacher, J.L., Deffenbacher, D.M., Lynch, R.S. & Richards, T.L. (2003). Anger, aggression, and risky behavior: a comparison of high and low anger drivers. In: Behaviour Research and Therapy, vol. 41, nr. 6, p. 701-718.

[13]. Nesbit, S.M., Conger, J.C. & Conger, A.J. (2007). A quantitative review of the relationship between anger and aggressive driving. In: Aggression and Violent Behavior, vol. 12, nr. 2, p. 156-176.

[14]. Ellison, P.A., Govern, J.M., Petri, H.L. & Figler, M.H. (1995). Anonymity and aggressive driving behavior: A field study. In: Journal of Social Behavior & Personality, vol. 10, nr. 1, p. 265-272.

[15]. Ellison-Potter, P., Bell, P. & Deffenbacher, J. (2001). The effects of trait driving anger, anonymity, and aggressive stimuli on aggressive driving behavior. In: Journal of Applied Social Psychology, vol. 31, nr. 2, p. 431-443.

[16]. Stephens, A.N., O’Hern, S., Trawley, S., Young, K.L., et al. (2019). Self-reported aggression amongst active cyclists. In: Accident Analysis & Prevention, vol. 128, p. 46-52.

[17]. CBS (2020). Veiligheidsmonitor 2019. Centraal Bureau voor de Statistiek CBS, Den Haag.

[18]. Kester, J. (2019). Onderzoek: Verkeersruzies. 1V OpiniePanel Rapport. EenVandaag.

[19]. Dagblad van het Noorden (2019). Weggebruikers ergeren zich kapot aan elkaar; hufterigheid neemt ook toe. Accessed on 04-09-2020 at www.dvhn.nl/extra/Weggebruikers-ergeren-zich-kapot-aan-elkaar-hufterigheid-neemt-ook-toe-24709999.html?harvest_referrer=https%3A%2F%2Ftoestemming.ndcmediagroep.nl%2F%3Ftoken%3Dc8ffaf7a-acdb-4a06-bb14-53ff2269daf4.

[20]. Dikke van Dale (2015). Van Dale Uitgevers, Utrecht.

[21]. Bieleman, B., Boendermaker, M., Mennes, R. & Snippe, J. (2014). Hard op weg. Onderzoek naar verkeersveelplegers. Politiekunde 65, Politie en Wetenschap. Reed Business, Amsterdam, Apeldoorn.

[22]. Goldenbeld, C. & Twisk, D.A.M. (2009). Verkeersovertredingen, veelplegers en verkeersonveiligheid. Kennis uit bestaand onderzoek [Traffic offences, multiple offenders and road safety. Knowledge from existing research]. R-2009-7 [Summary in English]. SWOV, Leidschendam.

[23]. Rijksoverheid (2016). Richtlijn voor strafvordering feitgecodeerde misdrijven en overtredingen 2016. Accessed on 17-11-2020 at wetten.overheid.nl/BWBR0037399/2016-01-01.

[24]. OM (2016). Veelplegers in het verkeer. Openbaar Ministerie. Accessed on 19-10-2020 at www.om.nl/onderwerpen/verkeer/handhaving/veelplegers-in-het-verkeer.

[25]. Minister van VenJ (2014). Brief Tweede kamer Stand van zaken aanpak veelplegers in het verkeer. Kamerbrief. Ministerie van Veiligheid en Justitie, Den Haag.

[26]. Goldenbeld, C., Reurings, M.C.B., Norden, Y. van & Stipdonk, H.L. (2011). Relatie tussen verkeersovertredingen en verkeersongevallen. Verkennend onderzoek op basis van CJIB-gegevens [The relation between traffic offences and road crashes. Preliminary study making use of Central Fine Collection Agency (CJIB) data]. R-2011-19 [Summary in English]. SWOV, Leidschendam.

[27]. NHTSA (2019). Distracted driving in fatal crashes, 2017. National Highway Traffic Safety Administration NHTSA, Washington, D.C.

[28]. Aarts, L.T., Loenis, B., Korving, H. & Guiking, C. (2017). Risicofactoren op 50km/uur-kruispunten met verkeerslichten. Methodologische verdieping en verdere verkenning van de kwantificering van risicofactoren zoals roodlichtnegatie [Risk factors at 50 km/h intersections with traffic lights. Methodological follow-up and further exploration of the quantification of risk factors such as red light runningrunning]. R-2017-21 [Summary in English]. SWOV, Den Haag.

[29]. Kuiken, M. & Stoop, J. (2012). Verbetering van fietsverlichting. Verkenning van beleidsmogelijkheden. Ministerie van Infrastructuur en Milieu (IenM), Directoraat-Generaal Rijkswaterstaat, Dienst Verkeer en Scheepvaart DVS, Delft.

[30]. AAA Foundation (2009). Aggressive Driving: Research Update. AAA Foundation for Traffic Safety, Washington.

[31]. Goldenbeld, C. & Buttler, I. (2019). Enforcement and traffic violations. ESRA2 Thematic report Nr. 6 - E-Survey of Road users’ Attitudes. SWOV, Den Haag.

[32]. Kint, S.T. van der & Mons, C. (2019). Interpolis Barometer 2019. Vragenlijststudie mobiel telefoongebruik in het verkeer [Interpolis Barometer 2019. Questionnaire study mobile phone use in traffic]. R-2019-26 [Summary in English]. SWOV, Den Haag.

[33]. Houwing, S., Twisk, D.A.M. & Waard, D. de (2015). Alcoholgebruik van jongeren in het verkeer op stapavonden. R-2015-12. SWOV, Den Haag.

[34]. Tajfel, H. & Turner, J.C. (1986). The social identity theory of intergroup behavior. In: Worchel, S. & Austin, W. (red.), Psychology of intergroup relations. Nelson-Hall, Chicago, p. 7-24.

[35]. Hoekstra, A.T.G., Twisk, D.A.M. & Hagenzieker, M.P. (2018). Do road user roles serve as social identities? Differences between self-described cyclists and car drivers. In: Transportation Research Part F: Traffic Psychology and Behaviour, vol. 59, p. 365-377.

[36]. Goldenbeld, C. & Mesken, J. (2012). Verkeersovertreders, achtergronden van gedrag en mogelijkheden voor beïnvloeding door voorlichting. Een literatuurstudie [Traffic offenders, backgrounds to behaviour and options for intervention through education. A literature study]. R-2012-15 [Summary in English]. SWOV, Leidschendam.

[37]. Mesken, J., Hagenzieker, M.P. & Rothengatter, J.A. (2008). A review of studies on emotions and road user behaviour. In: Dorn, L. (red.), Driver behaviour and training Vol III; Human factors in road and rail transport; based on the contributions for the Third International Conference on Driver Behaviour and Training. 12-13 November 2007. Ashgate, Aldershot, Dublin.

[38]. Rhodes, N. & Pivik, K. (2011). Age and gender differences in risky driving: The roles of positive affect and risk perception. In: Accident Analysis & Prevention, vol. 43, nr. 3, p. 923-931.

[39]. González-Iglesias, B., Gómez-Fraguela, J.A. & Luengo-Martín, M.Á. (2012). Driving anger and traffic violations: Gender differences. In: Transportation Research Part F: Traffic Psychology and Behaviour, vol. 15, nr. 4, p. 404-412.

[40]. Ball, L., Tully, R. & Egan, V. (2018). The influence of impulsivity and the Dark Triad on self-reported aggressive driving behaviours. In: Accident Analysis & Prevention, vol. 120, p. 130-138.

[41]. Bushman, B.J., Steffgen, G., Kerwin, T., Whitlock, T., et al. (2018). “Don’t you know I own the road?” The link between narcissism and aggressive driving. In: Transportation Research Part F: Traffic Psychology and Behaviour, vol. 52, p. 14-20.

[42]. Meunier, J.-C., Schinckus, L. & Kaiser, S. (2019). Themadossier Verkeersveiligheid nr. 20 – Risicobereidheid en agressie. Vias institute – Kenniscentrum Verkeersveiligheid, Brussel.

[43]. Bowen, L., Budden, S.L. & Smith, A.P. (2020). Factors underpinning unsafe driving: A systematic literature review of car drivers. In: Transportation Research Part F: Traffic Psychology and Behaviour, vol. 72, p. 184-210.

[44]. Goldenbeld, C. & Schagen, I. van (2016). Personal Factors – Sensation Seeking. European Road Safety Decision Support System, developed by the H2020 project SafetyCube. Accessed on 18-09-2018 at www.roadsafety-dss.eu.

[45]. Dahlen, E.R., Edwards, B.D., Tubré, T., Zyphur, M.J., et al. (2012). Taking a look behind the wheel: An investigation into the personality predictors of aggressive driving. In: Accident Analysis & Prevention, vol. 45, p. 1-9.

[46]. Goldenbeld, C., Torfs, K., Vlakveld, W. & Houwing, S. (2020). Impaired driving due to alcohol or drugs. International differences and determinants based on E-Survey of Road Users' Attitudes first-wave results in 32 countries. In: IATSS Research.

[47]. Goldenbeld, C., Blom, M. & Houwing, S. (2016). Zware alcoholovertreders in het verkeer. Omvang van het probleem en kenmerken van de overtreders [Serious alcohol offenders in traffic. Extent of the problem and characteristics of the offenders]. R-2016-12 [Summary in English]. SWOV, Den Haag.

[48]. Martí-Belda Bertolín, A., Pastor Soriano, J.C., Montoro González, L., Bosó Seguí, P., et al. (2019). Persistent traffic offenders. Alcohol consumption and personality as predictors of driving disqualification. In: The European Journal of Psychology Applied to Legal Context, 2019, vol. 11, nr. 2, p. 81-92.

[49]. Blom, M., Boschman, S.E. & Weijters, G. (2022). Differentiële effectiviteit maatregelen alcohol en verkeer. Cahier 2022-7. Wetenschappelijk Onderzoek- en documentatie Centrum WODC, Den Haag.

[50]. Blom, M., Blokdijk, D. & Weijters, G. (2017). Recidive na een educatieve maatregel voor verkeersovertreders of tijdens een Alcoholslotprogramma. Cahier 2017-15. Wetenschappelijk Onderzoek- en Documentatiecentrum WODC, Den Haag.

[51]. Blom, M., Blokdijk, D. & Weijters, G. (2019). Recidive na maatregelen rijvaardigheid en geschiktheid. Cahier 2019-20. Wetenschappelijk Onderzoek- en Documentatiecentrum WODC, Den Haag.

[52]. SUPREME (2007). Thematic report: Rehabilitation and diagnostics. Directorate-General for Transport and Energy (TREN), European Commission, Brussels.

[53]. Bjerre, B. & Thorsson, U. (2008). Is an alcohol ignition interlock programme a useful tool for changing the alcohol and driving habits of drink-drivers? In: Accident Analysis & Prevention, vol. 40, nr. 1, p. 267-273.

[54]. Gustafsson, S. & Forsman, A. (2016). Utvärdering av alkolås efter rattfylleri: enkätstudie [Evaluation of a Swedish alcohol interlock program for drink driving offenders: questionnaire study]. VTI-code: 35-2016; summary in English. VTI, Linköping.

[55]. Castillo-Manzano, J.I. & Castro-Nuño, M. (2012). Driving licenses based on points systems: Efficient road safety strategy or latest fashion in global transport policy? A worldwide meta-analysis. In: Transport Policy, vol. 21, p. 191-201.

[56]. Hoekstra, A.T.G., Eenink, R.G. & Goldenbeld, C. (2017). Progressief boetestelsel en verkeersveiligheid. Geschatte veiligheidseffecten van hogere boetes bij herhaalde snelheidsovertredingen [Progressive penalty system and road safety. Estimated safety effects of progressive fines for repeated speeding offences]. R-2017-3 [Summary in English]. SWOV, Den Haag.

[57]. Bolderdijk, J.W., Knockaert, J., Steg, E.M. & Verhoef, E.T. (2011). Effects of Pay-As-You-Drive vehicle insurance on young drivers’ speed choice: Results of a Dutch field experiment. In: Accident Analysis & Prevention, vol. 43, nr. 3, p. 1181-1186.

[58]. Dijksterhuis, C., Lewis-Evans, B., Jelijs, B., Waard, D. de, et al. (2015). The impact of immediate or delayed feedback on driving behaviour in a simulated Pay-As-You-Drive system. In: Accident Analysis & Prevention, vol. 75, p. 93-104.

[59]. Vlakveld, W. (2018). Notitie Monitor- en Feedbacksystemen. Literatuurstudie naar de effecten van monitor- en feedbacksystemen op het rijgedrag. R-2018-26. SWOV, Den Haag.

[60]. Neighbors, C., Vietor, N.A. & Knee, C.R. (2002). A motivational model of driving anger and aggression. In: Personality and Social Psychology Bulletin, vol. 28, nr. 3, p. 324-335.

[61]. Gemeente Amsterdam (2018). Verkeersbesluit Snorfiets naar de rijbaan met helmplicht te Amsterdam. In: Staatscourant van het Koninkrijk der Nederlanden, vol. Staatscourant 2018, 71559.

[62]. Stanojević, P., Sullman, M.J.M., Jovanović, D. & Stanojević, D. (2018). The impact of police presence on angry and aggressive driving. In: Accident Analysis & Prevention, vol. 110, p. 93-100.

[63]. Hoekstra, A.T.G. (2020). De effectiviteit van maatregelen op veelplegers in het verkeer; Een literatuurstudie [The effectiveness of measures targeting repeat traffic offenders; a literature review]. R-2020-9 [Summary in English]. SWOV, Den Haag.

[64]. Kuiken, M., Barten, M. & Fokkema, J. (2009). Aanpak van notoire Verkeersovertreders. Een verkenning. Directoraat-Generaal Rijkswaterstaat, Dienst Verkeer en Scheepvaart DVS, Delft.

1 + 15 =
Solve this simple math problem and enter the result. E.g. for 1+3, enter 4.

Would you like to cite this fact sheet?

SWOV publication

This is a publication by SWOV, or that SWOV has contributed to.