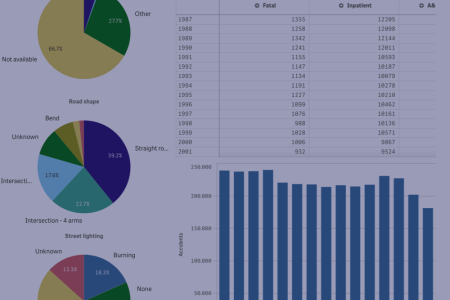
SWOV uses various data sources for its research. The SWOV website offers a considerable proportion of these data in graphs, tables and fact sheets. A recent update ensures easier access to the data and has increased the options to interact with data.
Make your own selections and interactive graphs or even export your selection as an image, PDF or XLSX file: just right click on any graph or table in the presented dashboard.