Sustainable Road Safety

Updated

Sustainable Road Safety implies that the traffic environment is designed to rule out serious crashes and to mitigate the severity of the crashes that do happen. The human dimension is the primary focus: man who is vulnerable, makes mistakes and does not abide by the rules. The road environment, vehicles and technology are to offer support and protection in order to make the safety of the traffic system as little dependent on individual actions as possible. Traffic professionals and central government ensure that these conditions are always met and that imperfections are corrected. By means of information and education, traffic professionals and road users are ready to meet the demands placed upon them. There should be a mechanism to eventually monitor if road users behave safely and if traffic professionals adequately fulfil their role. If in spite of these precautions accidents do happen, excellent trauma care ensures fast and effective assistance.

Between 1998-2007 measures were taken that were part of a Sustainably Safe Traffic System. In 2007, these measures resulted in a 30% decrease of road deaths compared to the number of expected fatalities if these measures had not been taken. The benefits outweighed the costs by a factor four. The third edition of the Sustainable Safety vision, published in 2018, is based on three design principles (Functionality, (Bio)mechanics en Psychologics) and two organization principles (Responsibility and Learning/Innovating). This fact sheet briefly describes the essence of Sustainable Safety in general and the third edition in particular. More information about Sustainable Safety is to be found on the website sustainablesafety.nl.

What does Sustainable Road Safety imply?

Sustainable Road Safety is a vision on how road safety can be systematically ensured to a maximum extent. The human dimension is the primary focus: man who is vulnerable, makes mistakes and does sometimes deliberately not abide by the rules. The vision is based on a pro-active approach: the traffic environment should be designed to rule out serious crashes. If an accident does happen, serious consequences should be limited. Sustainable Safety is a safe system approach: all elements of the traffic system are taken into account in interrelation to one another. Road Safety is thus the basic quality of road traffic. In practice, Sustainable Safety comes down to:

  • Roads, the road environment, vehicles and technological solutions are compatible with and supportive of human capabilities. In addition, they offer maximum protection – whether or not helped by extra means of protection – to all road users in or on a vehicle and in their immediate surroundings. Responsible organizations and the central government, as the ultimately responsible party, take care that these conditions are always met and that deficiencies are addressed.
  • Road users are prepared as much as possible for the traffic task through education, information and training. They are aware of the safety consequences of their own choices and what they can do about them. Traffic professionals involved in the development, implementation, management, and maintenance of the traffic system possess the knowhow to realize sustainable road safety.
  • Inspectors and law enforcement authorities exercise sufficient control to ensure that the system functions at maximum safety (both at the level of road and vehicle design as well as road user behaviour) and that traffic professionals exert themselves appropriately in their contribution to sustainably safe road traffic. Enforcement occurs on the basis of the most effective combination of regulation, inspection and fines. Unsafe behaviour by road users and by traffic professionals will, where possible, be ruled out or at least be made unattractive by effectively applying knowledge about the ‘human dimension’ in the design of the traffic system. This kind of enforcement is one of the roles of the government which is responsible for the system (see the question What does the organization principle ‘Responsibility’ imply?).
  • Trauma care and – where possible – technology in the vehicle ensure a fast response, optimum care and maximum recuperation of (seriously injured) road users. A short travel time to the hospital and sufficient space for trauma care are also important.

The vision of Sustainable Road Safety strives for maximum safety of the traffic system, that is to say a system that is as safe as possible. The vision identifies and acknowledges the mobility demands of various groups in our society, the importance of proper accessibility by road and the need for personal freedom of choice. It is a fact that certain modes of transport are inherently less safe (i.e. two-wheeled vehicles) and certain road users are more vulnerable to traffic injury than others (e.g. children, teenagers, seniors). To enhance safety we distinguish between eliminating, minimizing and mitigating risks:

  • Eliminating: ideally, dangerous situations are made physically impossible so that people do not find themselves in such situations.
  • Minimizing: choosing dangerous situations or modes of transport is made unattractive to limit people’s exposure to risks.
  • Mitigating: where people are exposed to risks, the consequences are mitigated by taking appropriate measures.
What principles in Sustainable Road Safety have been specified?

In Sustainable Safety five safety principles have been specified: three design principles and two organization principles.

The three design principles are:

  1. Functionality of roads: road sections and intersections have only one function: a traffic flow function or an exchange function. 
  2. (Bio)mechanics: limiting differences in speed, direction, mass and size and protection of the road user.
  3. Psychologics: aligning the traffic environment with road user competencies.

The protection of and feasibility for vulnerable road users (cyclists and seniors in particular) are important starting points for a more detailed elaboration of these safety principles.

The two organization principles are:

  1. Responsibility: responsibilities are laid down unequivocally and are in line with the tasks of the parties involved.
  2. Learning and innovating: traffic professionals continuously examine the causes of crashes and develop effective and preventive system innovations based on this research.

The traffic professional plays a central role where all these principles are concerned.

What does the design principle ‘Functionality of roads’ imply?

The design principle Functionality of roads implies that road sections and intersections have only one function for all modes of transport (mono-functionality) – a traffic flow function or an exchange function – and that these functions are built into the road network in a hierarchical and efficient way. 

Public space consists of dwelling areas and traffic areas. The traffic area consists of road sections and intersections to which the functionality principle applies.

We distinguish between two road functions: a traffic flow function and an exchange function. The flow function means that traffic participation does not involve interaction with the environment, whereas during exchange there is interaction with the environment and abrupt manoeuvres are also possible. These functions do not combine safely [1] [2] [3]. Road function is therefore the basis for a safe design and use of roads. A direct result of this is the division into road categories and the ideal structure of the road network.

In a hierarchical and efficient structure of the road network three road categories may be distinguished according to their functions (see also Figure 1 [4]):

  • Through-roads (flow function on road sections and across intersections);
  • distributor roads (flow functions on road sections and exchange function at intersections);
  • access roads (exchange function on road sections and at intersections).

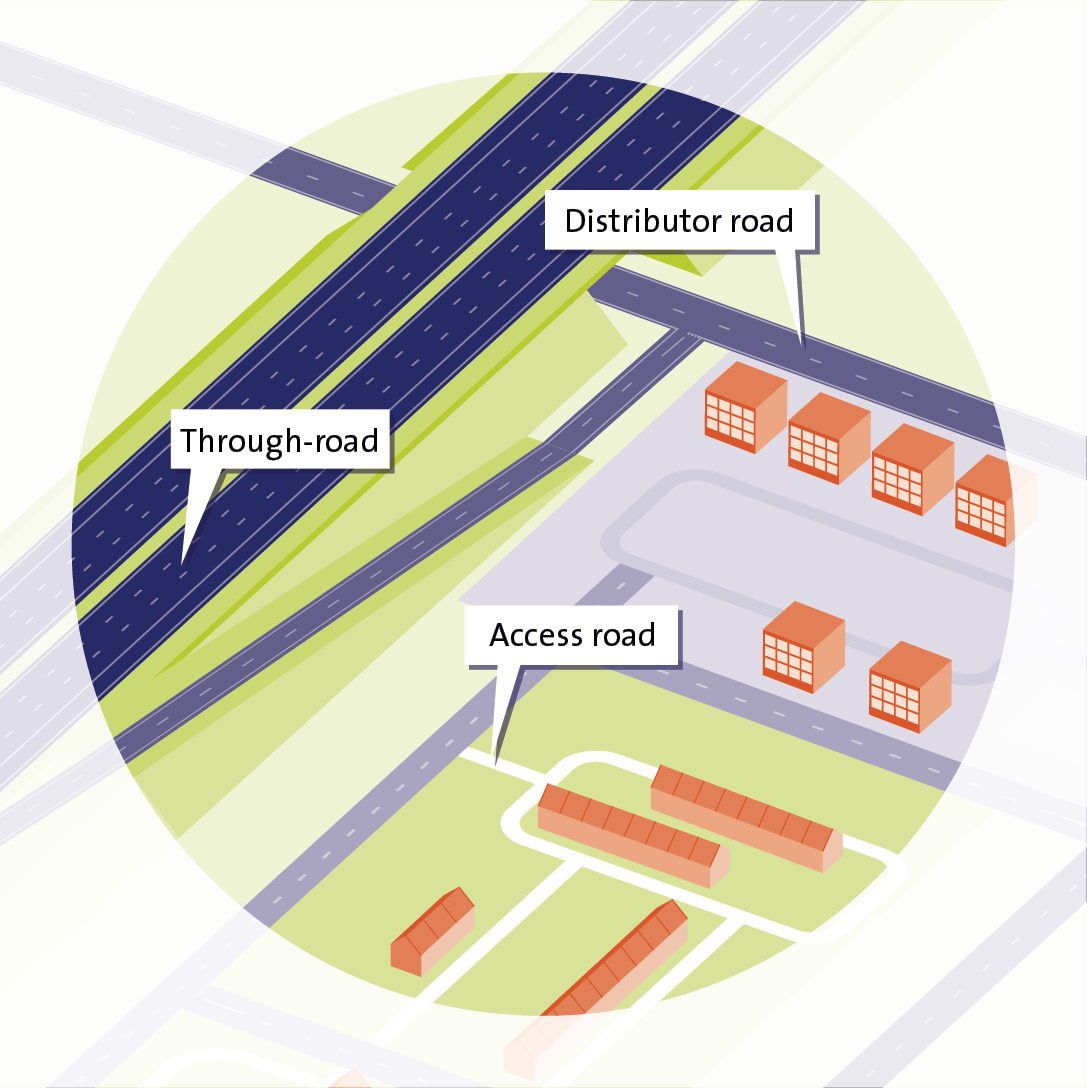
Figure 1. Functional classification of roads.

This functional classification of roads relates to the ‘traffic space’. ‘Dwelling’ functions such as playing and shopping do not combine safely with traffic, least of all with through-traffic (for example see [2]). Access roads, and in particular home zones, are the only type of traffic space that, where necessary, combines with an area’s dwelling function (for example see [5]). In cases where function, design and use do not correspond we talk about ‘grey roads’ (for example in a 50km/h shopping street; see also the design principle ‘Biomechanics’

See Aarts & Dijkstra [6], Chapter 3 for a more detailed discussion of this principle.

What does the design principle '(Bio)mechanics’ imply?

The design principle (Bio)mechanics implies that traffic flows and transport modes are compatible with respect to speed, direction, mass, size and degree of protection. This is supported by the design of the road, the road environment, the vehicle, and, where necessary, additional protective devices. For two-wheeled vehicles, it is important that the road and the road environment contribute to the stability of the rider.

In cases where (bio)mechanic compatibility between road users, their mode of transport and the road layout is still insufficient, the speed of all traffic should be adapted to the most vulnerable transport modes (in particular, walking and cycling) and road users (in particular, children and seniors; see [7] en [8]).

A detailed elaboration of the (bio)mechanics principle distinguishes between roads with a flow function and roads with an exchange function. Apart from this there are additional principles for cyclists.

Where traffic flows: Either physically or in time, motorized traffic is separated from low speed traffic, from traffic travelling in the opposite direction, from traffic with a substantially different mass or width, and from hazardous obstacles (see also [4] en [7]). For example: cyclists ride on a bicycle track and are directed by conflict-free traffic lights at intersections. The road and the immediate road environment are forgiving, which means that they are designed and built in such a way that the free flow speed is safe (see Table 1).

Furthermore, road users will be sufficiently physically protected by the vehicle or by protection devices on their bodies. For example: drivers are protected by rigid occupant compartments and other safety devices in the car; a motorcyclist wears a motorcycle outfit and an appropriate helmet. If a mode of transport cannot meet the speed, mass, size and road user protection criteria that are necessary for safe flowing, then this mode will not be allowed on roads intended for a flow function (through-roads or distributor roads). For such transport modes, special infrastructure is provided that is adapted to traffic with lower speed and smaller size, mass, and less protection. For example: cyclists and tractors are not allowed on 80km/h roads, whereas they are allowed on the adjacent service road with a lower speed limit. Incidentally, the latter may result in a different incompatibility: viz. the difference in mass and size between tractors and cyclists (who, moreover, lack adequate physical protection).

Where traffic exchanges: high-speed traffic drives at a safe lower speed in situations in which traffic has an exchange function. For example: speed at intersections is lower than speed on road sections, and in home zones and shopping zones speed is lower than on through-roads. This should minimize crash risk and crash consequences for vulnerable road users in particular (see for example [4], [7] and [8]). Road layout and the vehicle itself help achieve these lower speeds (see the Psychologics principle).

Apart from this, the road should offer enough room for passing and overtaking other road users.

Additional point of interest for the safety of cyclists: to prevent bicycle crashes that don’t involve motorized vehicles, and single-vehicle cyclist crashes, cyclists should have sufficient room for manoeuvring at low speed, a clean and skid-resistant road surface and a forgiving road environment without stability-undermining elements (e.g., sharp-edged elevation differences, obstacles; see [9], [10], [11] and [12]). In addition, they have made themselves adequately protected against injury if they fall (for example by means of a bicycle helmet) in cases where the road and road environment are not yet forgiving enough.


Potential conflicts and requirements associated with

Safe speed (km/h)

Possible conflicts with vulnerable road users in home zones 

(no foot paths and pedestrians using the carriageway)

15


Possible conflicts with vulnerable road users on roads and at intersections, including situations with bike lanes or advisory bike lanes

30 

No conflicts with vulnerable road users, except with helmet-protected riders of motorised two-wheelers (mopeds on the carriageway). Possible right-angle conflicts between motorised vehicles, possible frontal conflicts between motorised vehicles. Stopping sight distance ≥ 47 m

50 

No conflicts with vulnerable road users 

No right-angle conflicts between motorised vehicles, possible frontal conflicts between motorised vehicles

Obstacles shielded or obstacle-free zone ≥ 2.5 m, (semi)hard shoulder

Stopping sight distance ≥ 64 m

60 

No conflicts with vulnerable road users 

No right-angle conflicts between motorised vehicles, possible frontal conflicts between motorised vehicles

Obstacles shielded or obstacle-free zone ≥ 4.5 m, (semi)hard shoulder

Stopping sight distance ≥ 82 m

70 

No conflicts with vulnerable road users 

No right-angle or frontal conflicts between motorised vehicles

Obstacles shielded or obstacle-free zone ≥ 6 m, (semi)hard shoulder

Stopping sight distance ≥ 105 m

80 

No conflicts with vulnerable road users

No right-angle or frontal conflicts between motorised vehicles

Obstacles shielded or obstacle-free zone ≥ 10 m, hard shoulder 

Stopping sight distance ≥ 170 m

100 

No conflicts with vulnerable road users

No right-angle or frontal conflicts between motorised vehicles

Obstacles shielded or obstacle-free zone ≥ 13 m, hard shoulder 

Stopping sight distance ≥ 260 m

120 

No conflicts with vulnerable road users

No right-angle or frontal conflicts between motorised vehicles

Obstacles shielded or obstacle-free zone ≥ 14.5 m, hard shoulder

Stopping sight distance ≥ 315 m

130 

Table 1. Further elaboration of ‘safe speed limits’.[i] Differences with the row above are indicated in bold
See Aarts & Dijkstra [6], Chapter 4, for further information about the design principle (Bio)mechanics.


[i] Potential conflict situations demanding a maximum speed of 15km/h are based on [13]. Potential conflict situations and design requirements linked to safe speed limits between 30 and 120 km/h are based on [7] en [14]. Design requirements for safe travel on roads at 130 km/h have provisionally been specified but need further study.

What does the design principle ‘Psychologics' imply?

The design principle Psychologics implies that the design of the traffic system is aligned with the general competencies and expectations of particularly senior road users. This means that for them as well as others the information from the traffic system is perceivable, understandable (‘self-explanatory’), credible, relevant and practicable. Moreover, road users are capable of carrying out their traffic task and of adjusting their behaviour according to the task demands for safely participating in traffic under the prevailing circumstances. This applies for both drivers (skilled and fit for the driving task) and non-motorized road users (skilled in dealing with traffic and fit to participate in traffic). The Psychologics principle works out as:

Adapting the system to people first …..

Information from the traffic system is transferred by the road layout, the road environment, traffic signs, via the vehicle and via the technology used for these elements (see for example [15] [16] [17] [18] [19] [20] [21] and [22]). Information in this context may be explicit as well as implicit. Road users should be able to process this traffic information correctly – in particular senior road users, who are generally faced with diminishing physical and mental abilities, often aggravated by illness and disabilities (see the SWOV fact sheet The elderly in traffic). Designing the traffic system according to their needs will basically make the system safer for (almost) all road user groups (see also [23] and [24]). For example: speed limit signs, a credible road layout and speed indication in the car may all clarify the maximum speed on a particular road.

… adapting people to the system later

Adapting road behaviour to the task demands of safe traffic participation (see Figure 2) especially applies to road behaviour at a strategic level (selection of destination, travel mode and route) and at a tactical level (manoeuvres; see [25] and [26]). Road users are adequately educated, informed and trained. Road users who are still developing their task capability – for example children and teenagers – or people who (temporarily) lack sufficient task capability, participate in traffic under supervision of competent adults or under conditions that are less demanding (‘graduated licencing’; see also Fact sheets Traffic education en 18- to 24-year-olds: Young drivers). Drivers of motorized vehicles have sufficient task capability (both skilled in driving and fit-to-drive) and non-motorized road users, such as cyclists and pedestrians, are skilled in dealing with traffic and fit for participation in traffic. The task demands are higher when the vehicle constitutes a greater danger to others, for instance due to its greater mass or speed. Thus, for driving a lorry or coach a  special driving licence is needed that differs from that for driving a car.

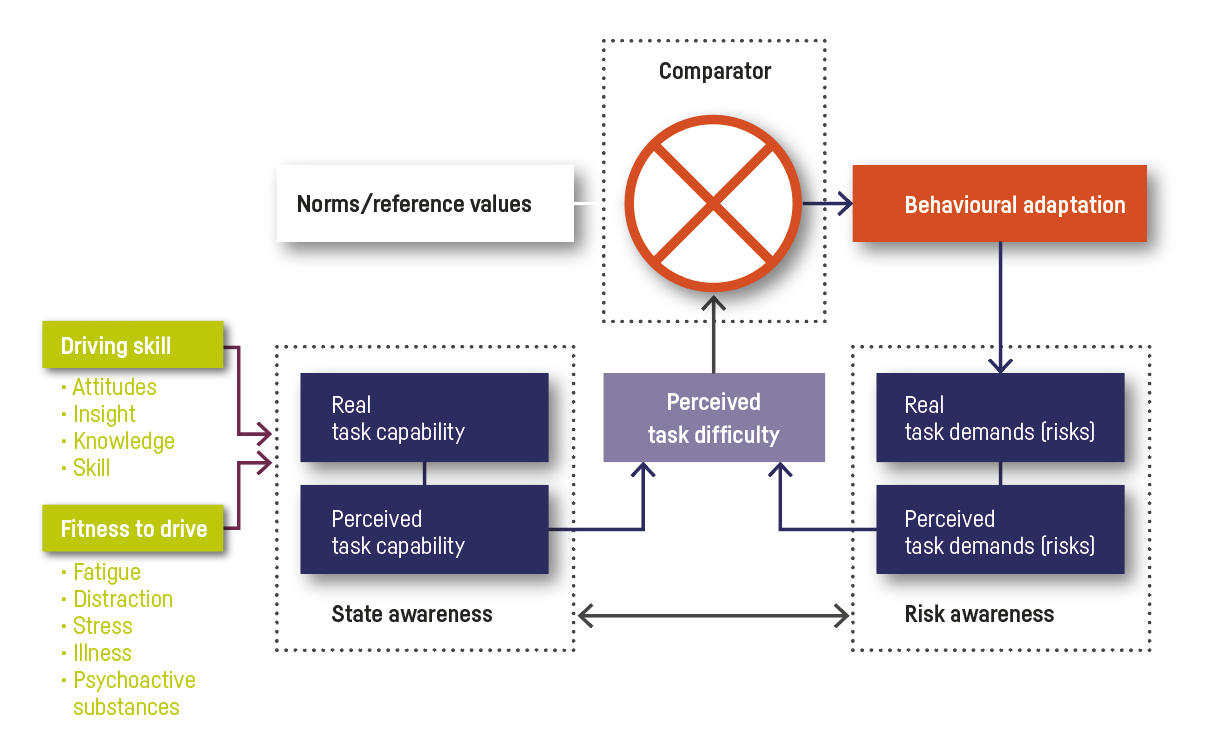
Figure 2. Schematic representation of the processes and factors that play a role in task capability of road users (see [26]).

General principle: Ideally, safe behaviour is as little dependent as possible on individual choices by road users. That is why road users are helped to make safe behavioural choices (for example by the use of Intelligent Speed Assistance – ISA) or by (temporarily) removing them from traffic if they prove to be insufficiently competent (for example by means of an alcolock or other smart devices). As long as the traffic system does not yet sufficiently support safe behavioural choices – in particular, safe speeds – adequate regulation, surveillance, detection, fines and information must be used for discouragement of (deliberately) dangerous traffic behaviours.

See Aarts & Dijkstra [6], Chapter 5, for more information about the Psychologics principle.

What does the organization principle ‘Responsibility’ imply?

The organization principle ‘Responsibility’ implies that responsibilities for a safe traffic system are specified in such a way that they guarantee a maximum road safety result for each road user and optimally integrate with the inherent roles and motives of the parties involved. There is a distinction between responsibility for the system or ultimate responsibility and operational responsibility. Below these different kinds of responsibility are detailed.

System responsibility or ultimate responsibility

The central government is ultimately responsible for road safety (see for example [27] [28] [29] [30] [31] and [32]). It ensures that short-term profit (economically speaking) does not hinder the realization of the long-term benefits associated with societal goals such as road safety [i]. Thus, it sets targets (for example in terms of the maximum number of road deaths and serious road injuries), in combination with intermediate goals (road safety performance indicators or SPIs; see Figure 3) and conditions  (for example financial incentives and ‘rules of the game’). These intermediate goals underpin the agreements with the stakeholders immediately involved and integrated policy planning (cf. the Swedish approach [34] and [35]).

The central government also establishes the appropriate conditions for implementation (for instance, via agreements and information about desired behaviour, results and consequences of policy and consumer choices). It implements laws and regulations with respect to the intended social result and is responsible for (financial) incentives to stimulate the desired behaviour of stakeholders. In all of this, the ‘human dimension’ [36] [37], is taken into account, while also accounting for utility (public interest) and proportionality (weighing costs and benefits). Finally, the central government monitors the results and adjusts the (intermediate) goals accordingly and, if necessary, the conditions as well (in accordance with the policy cycle, see [38]).

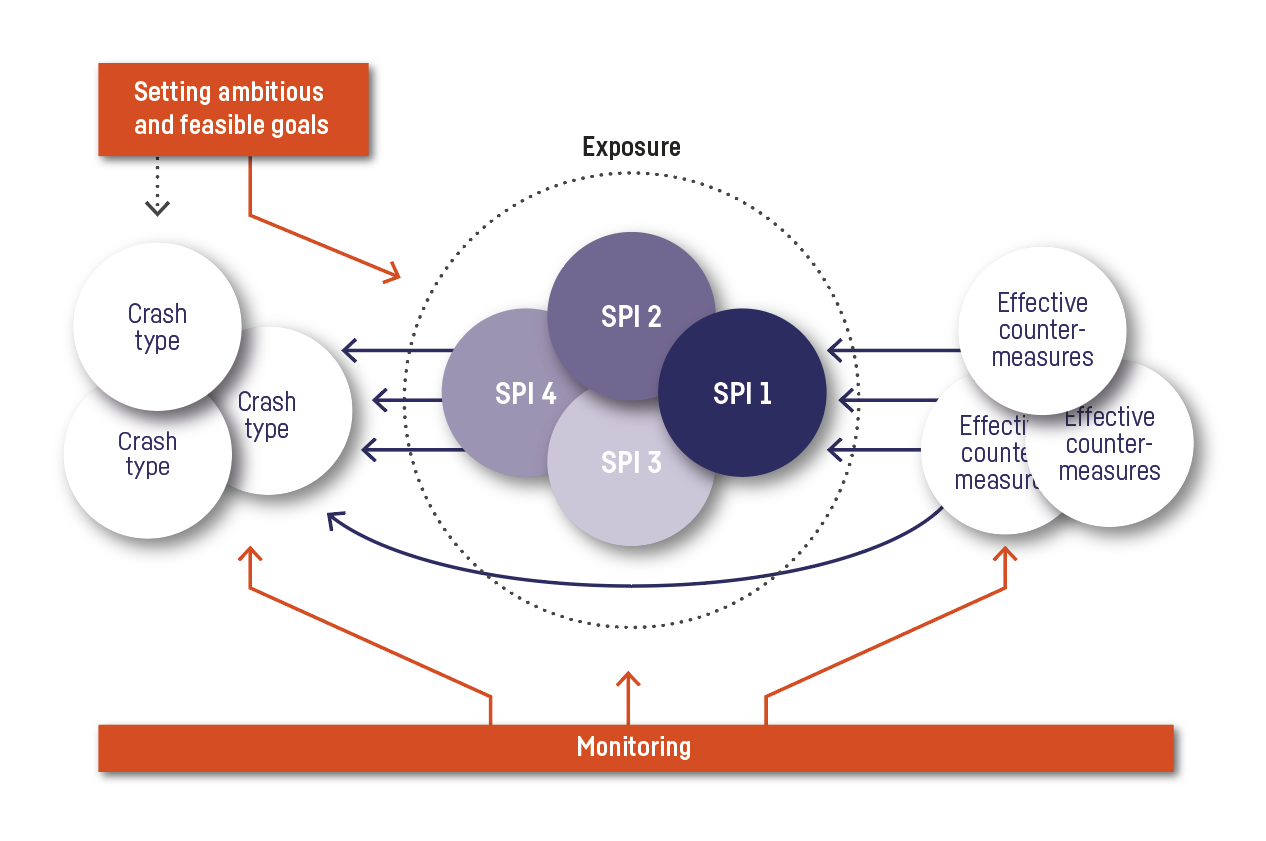
Figure 3. Relationship between crashes, risk factors (SPIs) and countermeasures and the connecting activities necessary to contribute to a sustainably safe traffic system: setting aims, taking countermeasures and monitoring (see also the Learning and Innovating principle).

Operational responsibility

Spatial planners, road authorities, enforcement officers, lawmakers, safety education officers and other traffic professionals carry operational responsibility to realize what is in fact a sustainably safe traffic system (see also [29] and [30]. For example:

  • Spatial planners plan community and neighbourhood development patterns that lead to a safe hierarchical road network structure (see the Functionality principle).
  • Road authorities see to it that roads are safely designed and maintained, according to their function (see the (Bio)mechanics and Psychologics principles, see also SWOV fact sheet Principles for safe road design).
  • Lawmakers draft fair, safe and credible laws and enforcement officers work towards honest and effective respect for the rules (see the Psychologics principle; see also SWOV fact sheets Police traffic enforcement and Speed and speed management).
  • Safety education officers and campaigners make sure that road users are optimally equipped and have been able to practise in a safe learning environment (see the Psychologics principle; see SWOV fact sheets Public service advertising and Traffic education).
  • Policymakers stimulate safe choices and check that no products are sold or used that contribute to a lack of road safety.
  • The private sector – including vehicle manufacturers – develops products that offer road users maximum protection for themselves and those around them, and support them in making safe behavioural choices. Industry develops strategies to make the safest products most attractive to consumers and employees.
  • Providers of leisure activities (societies, clubs, bars etc.) contribute to safe traffic participation conditions for their members and for consumers. For example, they encourage road users not to drink too much alcohol (see SWOV fact sheet Drink driving)
  • and offer an attractive range of non-alcoholic alternatives. They point customers to traffic rules and encourage them to pay attention to safe road behaviour.
  • Employers and product manufacturers provide safe road traffic conditions by ensuring that productivity is not at the expense of road safety (drivers are given enough time to transport products and are not tempted to use their phones while driving) and by ensuring sufficiently safe working conditions.
  • Social organizations examine whether the road safety interests of their clients are sufficiently served and develop improvement initiatives when necessary (see for example [39] and [40]).

In cases where operational responsibilities are not optimally assigned or where there are conflicts with other interests, the protection of vulnerable road users has priority. The government is responsible for making the traffic system forgiving for this group in particular (see also Aarts & Dijkstra [6], Chapter 6, for a more detailed elaboration of this principle).


[i] The concept of Sustainable Development from the Brundtland-rapport [33] .

What does the organization principle ‘Learning and innovating imply?

The organization principle Learning and innovating implies that traffic professionals continually investigate crash causes and develop associated effective and preventive system innovations (Plan). By implementing these innovations (Do), by monitoring their effectiveness (Check) and by making the necessary adjustments (Act), system innovation ultimately results in fewer crashes and casualties. Thus, in the process of learning and innovating, all stages of the Plan-Do-Check quality cycle are completed and embedded in an organizational framework (see Figure 4).

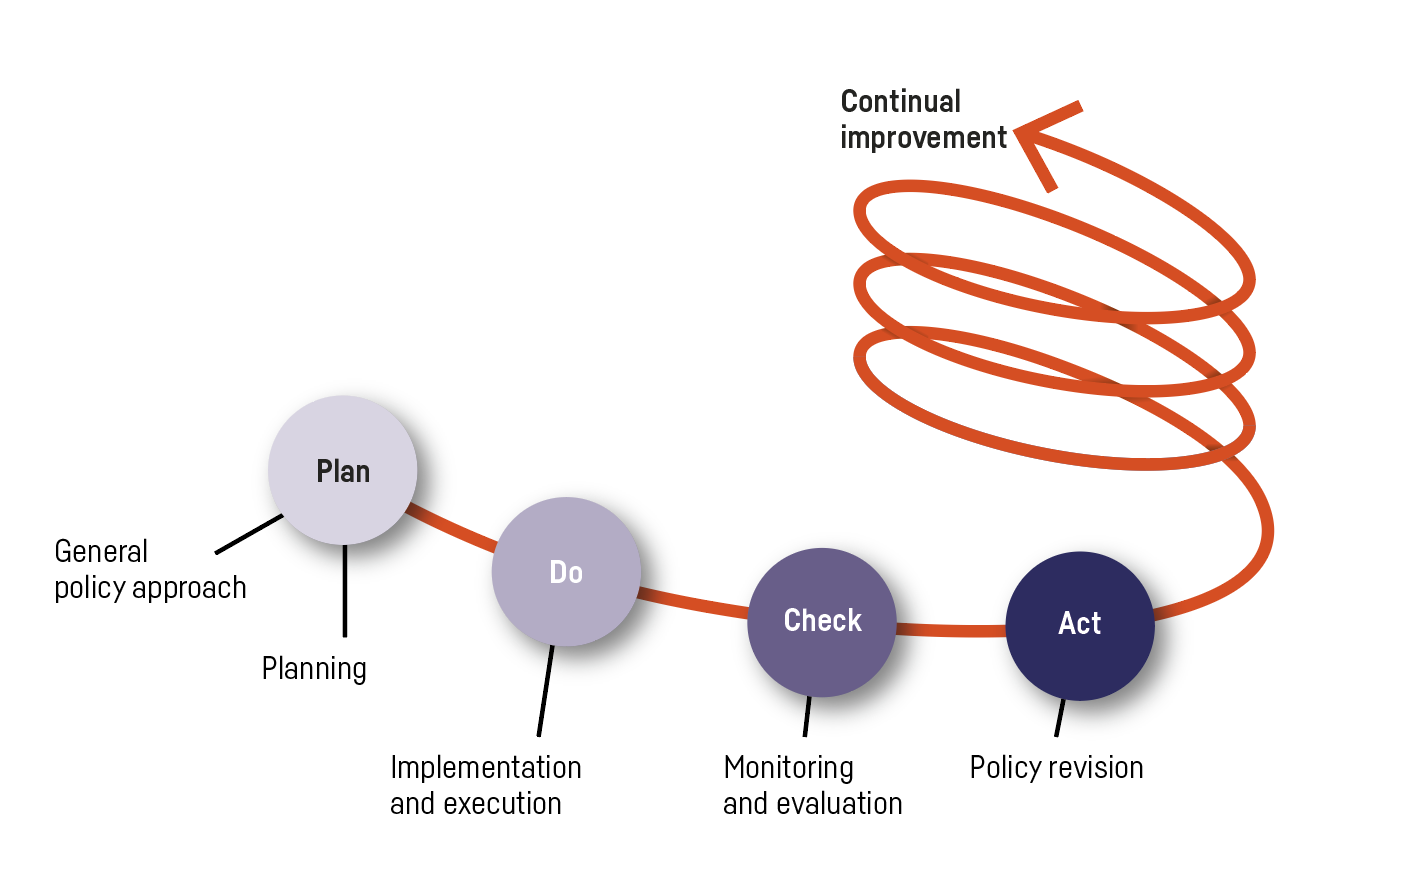
Figure 4. Plan-Do-Check-Act quality cycle (after [38]) as used in ISO standards for quality management).

To gain a clearer picture of crash causes and crash mechanisms, researchers carry out an in-depth analysis of all fatal road crashes in the Netherlands (see also [41] and [42]). Where possible, this is complemented with research into other serious crashes and with knowledge gained by linking data files (see also [43]).

Policy-makers and scientists define appropriate additional safety indicators [i] such as risk factors (SPIs [45] [46] and conflicts (see also [44]). These indicators are structurally monitored, as is the implementation of (associated) countermeasures. Citizens’ complaints may act as an incentive to check whether there is evidence of risk factors, such as a hazardous road design or unsafe behaviour (see for example [47] and the archived SWOV fact sheet Subjective lack of road safety).

Stakeholders, such as policy-makers, market players, scientists and lobbyists, contribute to innovations by interconnecting problem awareness and (possibly) effective countermeasures and procedures. Subsequently, these countermeasures and procedures are evaluated to see whether, and in which conditions, they are indeed effective.

Organizations employing traffic professionals see to adequate knowledge transfer within their own sections and stimulate active knowledge sharing and ongoing professionalization of employees (education of traffic professionals). Not only do they offer factual information, they also open up networks which knowledge can be drawn from. Knowledge institutes may play an active role in this networking.


[i] Scientifically known as 'surrogate safety measures'. See for example [44].

How did Sustainable Safety develop?

The Sustainable Safety vision dates back to the early nineties. Both the vision itself and the resultant measures have evolved over the years.

1992-2002: The Sustainable Safety vision was conceptualized in the early nineties on the basis of insights gained from research into human behaviour in an environment that is inadequately tuned to human competence [4]. These insights had previously been gained and applied in the process and aviation industries. In the mid-nineties, the Ministry of Infrastructure and Water Management launched a number of regional demonstration projects [48] [49] that culminated in the Start-up Programme Sustainable Safety: a covenant between central government and local authorities about the implementation of the first stage of Sustainable Safety, co-financed by the state [50]. This resulted in categorization of all roads, large-scale implementation and expansion of 30 and 60 km/h areas, the redirection of mopeds to the carriageway when safe to do so, priority for all traffic coming from the right (including slow traffic), preparations for permanent traffic education, and enforcement to be embedded and intensified regionally.

2003-2017: The second stage of Sustainable Safety started in 2003. The vision was no longer laid down in separate agreements but became part of general policy plans [51]. Apart from ongoing implementation of Sustainable Safety measures, the implementation of ‘essential predictablility characteristics’ entered the programme. To add fresh impetus to the Sustainable Safety philosophy and align it with several social developments, Advancing Sustainable Safety was published in 2005 [52].

From 2018 onwards: the third edition of Sustainable Safety was published in 2018 ([53]; see sustainablesafety.nl) in which previous principles have evolved and been updated and which also pays explicit attention to organizational aspects. The Sustainable Safety principles have been included as a possible approach in nine road safety themes of the new Strategic Road Safety Plan of the Dutch Ministry of Infrastructure and Water Management [54].

In addition, the Strategic Plan focuses on the way in which government authorities are planning to co-operate. A risk-based approach is key, which is an elaboration that is appropriate to the Sustainable Safety principle of ‘responsibility’.

The table below summarizes how previous and current Sustainable Safety principles are related.

Towards a sustainably safe road traffic (1992-2010)

Advancing Sustainable Safety

(2005-2020)

Sustainable Safety, third edition

(2018-2030)


Functionality of roads

Functionality of roads

Functionality of roads


Homogeneity in mass, speed and direction

Homogeneity in mass, speed and direction

(Bio)mechanics: aligning speed, direction, mass, size and protection of road users


Physical forgivingness

Social forgivingness


Psychologics: aligning the traffic environment and competencies of road users


Predictability of traffic behaviour by recognizable road design

Recognizable road design, predictable road course and behaviour


Status awareness


Effectively allocating responsibility


Learning and innovating in the traffic system


Table 2. The road safety principles in the various editions of Sustainable Safety.

Has Sustainable Safety increased road safety?

The Sustainable Safety measures in the Netherlands, taken between 1998 and 2007, have resulted in a 30% decrease in road deaths in 2007 compared to the expected number of road deaths had these measures not been taken (See also Figure 5). This concerns a total of 1600 to 1700 road deaths in the abovementioned period [55]. This number primarily involves road deaths in motorized traffic crashes: the measures taken had primarily focused on these crashes. In that same period, risk also decreased, from a 2.6% average decrease to a 5.8% average decrease per year. The benefits of the Sustainable Safety policy in this period proved to be twice to four times as high as the costs [56].

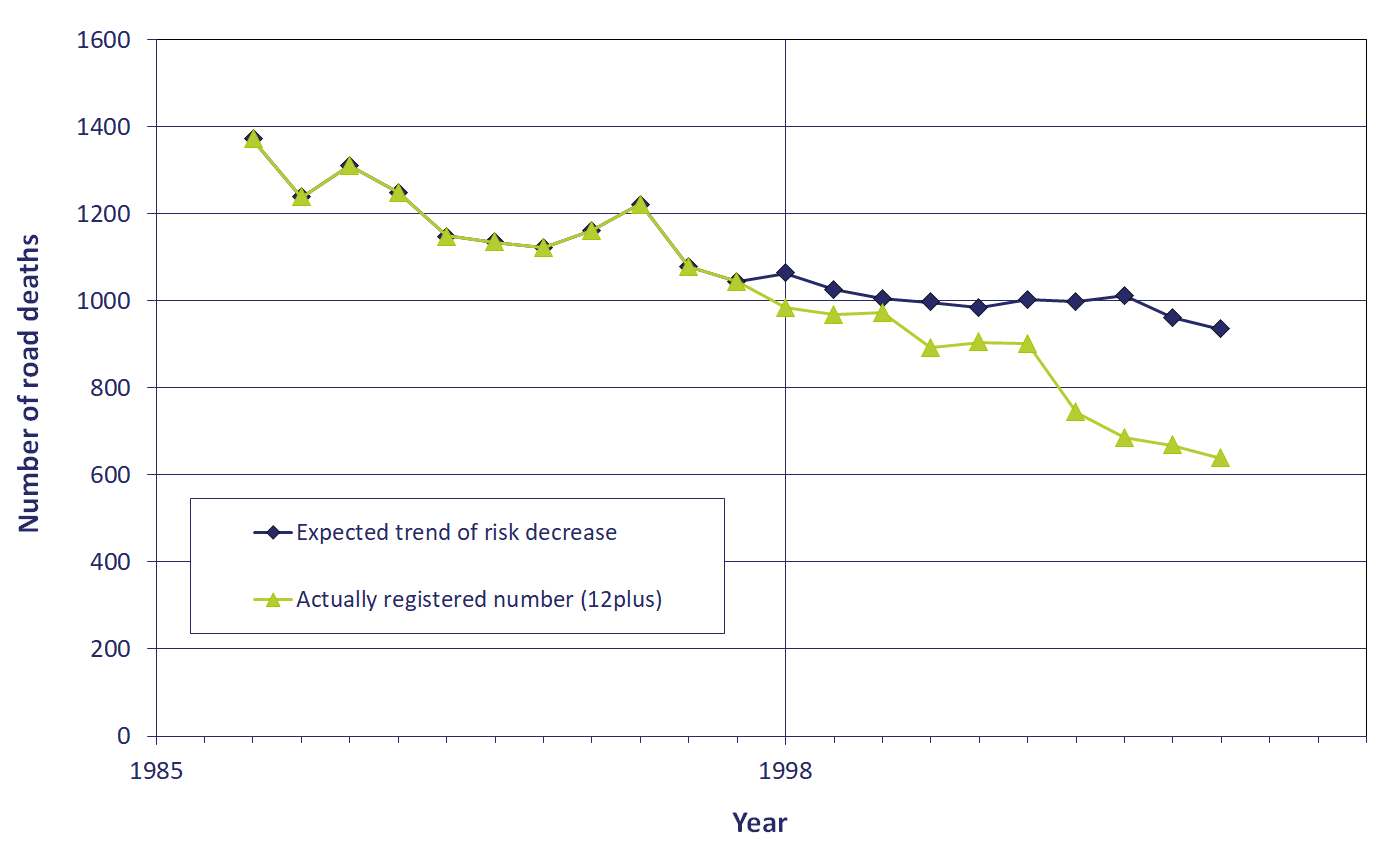
Figure 5. Development in registered number of road deaths (in population over 12 years of age) in relation to the expected trend had the existing policy been continued (so without Sustainable Safety) [56].

How to translate Sustainable Safety principles into Sustainable Safety measures?

Sustainable Safety can only effectively reduce the number of casualties if it is put into practice. It is therefore important to turn Sustainable Safety principles into measures. Two steps are needed:  

Step 1 - from principles to requirements

First, the principles should be operationalized. This entails a clear description of the requirements our traffic system should meet: 'requirements for sustainable road safety'. These previous examples may be built on:

  • Functional requirements for a sustainably safe infrastructure [57], among wich:
    • make parts of routes on relatively unsafe roads as short as possible;
    • make route length as short as possible;
    • coincide shortest and safest route;
    • prevent searching;
    • make road categories recognizable.
  • The official learning objectives for permanent road safety education for children and their attendants [58].
     
  • The operational requirements for enforcement, see for example [59]:
    • increase subjective probability of detection;
    • ensure a high degree of confidence that a violation will be countered by a sanction;
    • have sanction soon follow violation.
  • Operational requirements from a psychological perspective, [19], among wich:
    • restrict additional work load;
    • timely present information;
    • prioritize information according to relevance, dependent on context and urgency;
    • prevent visual and auditory distraction from the driving task.

For the third edition of Sustainable Safety a number of these operational requirements still need to be elaborated on, to be appropriate to the present principles. These will, however, build on the previous requirements.

Step 2 - from requirements to measures

The operational requirements are at the basis of legislation and guidelines and, eventually, the measures needed. The Sustainable Safety principles of the third edition are worded in such a way that the conversion into measures is receptive to future developments. For example: by realising the physical and infrastructural separation of traffic modes and by enhancing recognition of road types now, future use of intelligent vehicle technology will be facilitated.

Aarts and Dijkstra [6] recommend the following Sustainable Safety measures:

  1. Start from an actual road safety problem (inherent unsafety, in particular if it concerns a large group of casualties).
  2. Find out which operational requirements might solve the problem; reviewing them in full (based on the various Sustainable Safety principles and elements of the traffic system).
  3. Take stock of the approaches to meet the operational requirement: approaches that fit within the Sustainable Safety vision in its entirety.
  4. Find out which actors have an impact on possible approaches and ensure a transparent allocation of responsibilities and tasks.
  5. Regularly monitor whether the measures have indeed been taken and have been effective.

Organizations that have an impact on road safety may adopt the abovementioned recommendations autonomously; it would also be appropriate that - in the same way as in the days of the Sustainable Safety Start-up programme - a coherent set of agreements is made by central and local governments and possibly other organizations to further implement Sustainable Safety measures. Subsequently, political policies and appropriate conditions will determine to what extent effective measures are put into actual practice [60].

What are possible obstacles to the implementation of Sustainable Safety measures?

Over the years, quite a number of Sustainable Safety measures, or measures in the spirit of this vision, have been applied [6] [56]. Yet, in a number of situations and at different places compromises have been made or measures have not gained traction.

The obstacles having featured in the roll-out of Sustainable Safety may be summarized as follows[60]:

  1. Lack of knowledge about effective measures and the way in which these measures relate to the vision.
  2. General problems, such as a difference of interests and lack of physical space and resources.
  3. Decentralization and the subsequent liberty for different regions to do things their own way (and possibly less effectively) have also played a role.
  4. Deviating from the knowledge accumulated in guidelines has also been permitted (see also [61]) which has put a strain on uniformity to all road users and turned suboptimal solutions into legitimate options.
How does Sustainable Safety relate to other road safety visions?

Sustainable Safety is one of the road safety visions which are internationally known as a proactive system approach, or a ‘safe system approach’ [30] [31]. The Swedish Vision Zero is another well-known example of a  ‘safe system approach’ (see the question How does Sustainable Safety relate to Vision Zero? ). Apart from the Netherlands and Sweden, a 'safe system approach' has also been chosen as the preferred road safety policy by, for example, Australia en New Zealand. Only in the Netherlands and Sweden does this approach come under a specific name (Sustainable Safety and Vision Zero respectively).

According to OECD/ITF [30] a ‘safe system approach’ is characterized by the concept that risks are inherent in traffic and that they require a comprehensive approach of the different elements in the traffic system. This approach takes the fullest possible account of human vulnerability and fallibility, and calls for commitment of all relevant stakeholders, such as road authorities, police, the judiciary, and commercial parties. Road users are required to abide by the rules, but when and where they do not, the system is corrective (informative and enforcing) and forgiving (no serious consequences of unsafe behaviour). A ‘safe system approach’ also involves growing social awareness of a lack of road safety. This is needed since, first of all, people are only partially aware of inherent traffic risks and, secondly, since road users only notice a limited number of individual crashes and have no overview of how these crashes form a collective and substantial problem. Both Sustainable Safety and Vision Zero are held up as examples of 'safe system' approaches by the OECD and UN alike.

How does Sustainable Safety relate to Vision Zero?

Like Sustainable Safety, the Swedish Vision Zero is internationally known as a ‘safe system approach’ [30] [31]. Also see the question How does Sustainable Safety relate to international road safety visions? Vision Zero contends that it is immoral to accept road casualties. Like Sustainable Safety, Vision Zero takes the 'human dimension' as the guiding principle in a safe layout of the traffic system. Safe road layout, appropriate legislation and enforcement are the associated government responsibilities [62]. Citizens are responsible for abiding by the rules. Unlike Sustainable Safety, education and information campaigns are not part of Vision Zero (see for instance [63] or an interview with founding father Claes Tingvall [i]). Vision Zero is a long term ambition with intermediate specific objectives: ’management by objectives‘. 

Meanwhile, the European Union has embraced ‘Vision Zero’ and aims to rule out road deaths and serious road injuries in the long run. Other countries, among which the United Kingdom and Luxemburg, and several major cities in Europe and North America have also adopted a Vision Zero [30]. In the Netherlands, several provinces have adopted a long term vision of a traffic system without any casualties. With the publication of the Dutch Strategic Road Safety Plan this ambition has been nationally embraced as well [54]. Common ground is, above all, the moral premise not to accept any casualties at all. This does not always imply that the ‘safe system approach’ is adopted to achieve a casualty-free traffic system. In other words: Vision Zero does not automatically imply that a 'safe system' approach is chosen. However, in both the Swedish Vision Zero and in the third edition of Sustainable Safety this link is explicitly made. Thus, the third edition of Sustainable Safety is subtitled: principles for a casualty-free road traffic system.

How does Sustainable Safety relate to a risk-based approach?

A risk-based approach is a form of a proactive road safety policy that has attracted growing government attention in the Netherlands (see for instance [64] [65] [66] [67]). This approach is also part of the Dutch Strategic Road Safety Plan [54]. A proactive policy implies that the traffic system is made safer before crashes have actually occurred. In aiming to prevent crashes and serious injuries, Sustainable Safety is a typical example of a proactive policy (also see the question What does Sustainable Safety imply?) that may serve as a basis for a risk-based policy. A risk-based approach makes use of the characteristics of the traffic system – for instance road layout or dangerous behaviour – which show a strong causal link with the occurrence or the severity of crashes (see for instance [45] [68] [69])

In the context of Sustainable Safety, the Netherlands have had a proactive road safety policy for many years. In recent years, however, a shift in emphasis has emerged. Until recently, the proactive policy involved the implementation of countermeasures for those locations and for those road user groups where possible road safety problems were expected to occur. This policy was usually not guided by indicators of specific location or area characteristics, the so-called Safety Performance Indicators (SPIs; for an overview, see for instance [70].
Different domains have their own SPIs:

  • safe infrastructure;
  • safe vehicles;
  • safe speed;
  • safe road users;
  • excellent trauma care.

SPIs may be used to find out to what extent the generic proactive policy has already been implemented at specific locations (for instance a safe infrastructure) and has led to the desired results (for instance safe speeds, (hardly) anyone drink driving anymore). A risk-based policy starts from the scores concerning one or more of these SPIs and a subsequent approach to get higher scores and improved safety. For years now, a similar approach has been followed by Sweden (see for instance [71]). Moreover, in Sweden SPIs are linked to stakeholders who may influence the relevant indicators, such as road authorities, insurance companies, the taxi industry, or enforcers. This is an excellent example of how the Sustainable Safety principle ‘Responsiblity’ may take shape (also see the question What does the organization principle ‘Responsibility’ imply?).

How does Sustainable Safety relate to Shared Space?

The traffic concept Shared Space focuses on the entire design of public space, in particular that of residential areas. Like Sustainable Safety, Shared Space sets requirements to a credible layout of residential areas with the idea that high-speed traffic is only a guest in these areas or may be a threat to vulnerable road users and should therefore drive at a low speed [72] [73] [74]. Like Sustainable Safety, it emphasizes the importance of an appropriate road network structure with sufficient through-roads to prevent rat runs through residential areas.

Shared Space contends that traffic conflicts are best handled by incorporating uncertainty into the traffic situation through minimizing the number of traffic and road signs. This way, road users should pay more attention and work things out together, for instance by means of eye contact. Sustainable Safety, by contrast, relies on ‘recognizability and predictability’ and lays the burden of responsibility for safe traffic circulation on the shoulders of those who are responsible for the system, rather than on the shoulders of the road user.

Shared Space wants to make the public space layout credible by means of ‘natural’ elements. Sustainable Safety does not rule out this solution – provided it results in lower speeds and safe encounters – but also uses traditional traffic engineering countermeasures (speed humps, raised intersections, road narrowing) that have proved to lower speeds effectively.

Publications and sources

Read more

On the website www.sustainablesafety.nl you will find an overview of all SWOV publications concerning Sustainable Safety.

SWOV (2018). DV3- Duurzaam Veilig Wegverkeer 2018-2030. Principes voor ontwerp en organisatie van een slachtoffervrij verkeerssysteem. SWOV, Den Haag.

Van Schagen, I. & Aarts, L. (2018). DV3 – Huidige situatie, maatschappelijke trends en wensbeelden. Kader voor de visie Duurzaam Veilig Wegverkeer 2018-2030. R-2018-6A. SWOV, Den Haag.

Aarts, L. & Dijkstra, A. (2018). DV3 – Achtergronden en uitwerking van de verkeersveiligheidsvisie. De visie Duurzaam Veilig Wegverkeer voor de periode 2018-2030 onderbouwd. R-2018-6B. SWOV, Den Haag

Sources used in this publication

Below, you will find a list of references used in this fact sheet. All sources used may be accessed via our library portal where more literature on this subject may also be found.

[1]. Buchanan, C. (1963). Traffic in towns: A study of the long term problems of traffic in urban areas. Reports of the Steering Group and Working Group appointed by the Minister of Transport. Her Majesty's Stationery Office, London, UK.

[2]. Janssen, S.T.M.C. (1974). Verkeersveiligheid als criterium voor het wegontwerp. In: Congresdag 1974. Wegontwerp en wegverlichting tegen de achtergrond van de verkeersveiligheid. 6 december 1974, Utrecht, p. p. 13-40.

[3]. Swedish National Board of Urban Planning (1968). Principles for urban planning with respect to road safety: the Scaft Guidelines 1968. Statens Planwerk Publication no. 5. Swedish National Board of Urban Planning, Stockholm.

[4]. Koornstra, M.J., Mathijssen, M.P.M., Mulder, J.A.G., Roszbach, R., et al. (1992). Naar een duurzaam veilig wegverkeer. Nationale Verkeersveiligheidsverkenning voor de jaren 1990/2010. SWOV, Leidschendam.

[5]. Delbressine, R.R.H.L. (2013). The traffic safety of bicycle streets in the Netherlands. Master Thesis Delft University of Technology. Delft.

[6]. Aarts, L. & Dijkstra, A. (2018). DV3 – Achtergronden en uitwerking van de verkeersveiligheidsvisie. De visie Duurzaam Veilig Wegverkeer voor de periode 2018-2030 onderbouwd. R-2018-6B. SWOV, Den Haag.

[7]. Tingvall, C. & Haworth, N. (1999). Vision Zero: An ethical approach to safety and mobility. In: Proceedings of the 6th ITE International Conference Road Safety & Traffic Enforcement: Beyond 2000. Melbourne, 6-7 September 1999.

[8]. Rosén, E., Stigson, H. & Sander, U. (2011). Literature review of pedestrian fatality risk as a function of car impact speed. In: Accident Analysis & Prevention, vol. 43, nr. 1, p. 25-33.

[9]. Davidse, R.J., Duijvenvoorde, K. van, Boele, M.J., Doumen, M.J.A., et al. (2014). Letselongevallen van fietsende 50-plussers; Hoe ontstaan ze en wat kunnen we eraan doen? R-2014-3. SWOV, Den Haag.

[10]. Ormel, W., Klein Wolt, K. & Hertog, P. den (2009). Enkelvoudige fietsongevallen; Een LIS-vervolgonderzoek. Directoraat-Generaal Rijkswaterstaat, Dienst Verkeer en Scheepvaart DVS, Delft.

[11]. Schepers, P. (2013). A safer road environment for cyclists. Doctoral thesis Technische Universiteit Delft TUD, SWOV-Dissertatiereeks, SWOV, Leidschendam.

[12]. Wijlhuizen, G.J., Petegem, J.W.H. van, Goldenbeld, C., Gent, P. van, et al. (2016). Doorontwikkeling CycleRAP-instrument voor veiligheidsbeoordeling fietsinfrastructuur. R-2016-11. SWOV, Den Haag.

[13]. Ministerie van VenW (1985). Van woonerf naar erf: voorstelling voor aanpassing van de woonerfwetgeving. Eindrapport van de Werkgroep Erven in het kader van maatregel 333-3 van het Nationaal Plan voor de Verkeersveiligheid NVP. Directie verkeersveiligheid, Ministerie van Verkeer en Waterstaat, Den Haag.

[14]. Aarts, L.T. & Nes, N. van (2007). Een helpende hand bij snelhedenbeleid gericht op veiligheid en geloofwaardigheid. Eerste aanzet voor een beslissingsondersteunend instrument voor veilige snelheden en geloofwaardige snelheidslimieten. D-2007-2. SWOV, Leidschendam.

[15]. Vlakveld, W.P., Boele, M.J., Aarts, L.T. & Schermers, G. (2013). Natuurlijk Sturen in Limburg. Een kijkgedrag- en snelheidsonderzoek en een verkeerskundige analyse van twee aangepaste wegen. R-2013-2. SWOV, Leidschendam.

[16]. Aarts, L.T., Davidse, R.J. & Christoph, M. (2007). >Herkenbaar wegontwerp en rijgedrag. Een rijsimulatorstudie naar herkenbaarheid van gebiedsontsluitingswegen buiten de bebouwde kom. R-2006-17. SWOV, Leidschendam.

[17]. Theeuwes, J. (1991). Visual search of traffic scenes. Report IZF 1991 C-18. TNO Technische Menskunde, Soesterberg.

[18]. Wildervanck, C. (2008). 10 gouden regels om rekening te houden met de weggebruiker. Directoraat-Generaal Rijkswaterstaat, Dienst Verkeer & Scheepvaart DVS, Delft.

[19]. Kroon, E.C.M., Martens, M.H., Brookhuis, K.A., Hagenzieker, M.P., et al. (2016). Human factor guidelines for the design of safe in-car traffic information services. Smart mobility round table human behaviour. DITCM, Helmond.

[20]. PIARC (2015). Road safety manual: a guide for practitioners. World Road Association PIARC, Parijs.

[21]. Alexander, G.J. & Lunenfeld, H. (1986). Driver expectancy in highway design and traffic operations: final report. FHWA-TO-86-1. Department of Transportation DOT, Federal Highway Administration FHWA, Office of Traffic Operations, Washington D.C.

[22]. Goldenbeld, C., Groot-Mesken, J. de & Temürhan, M. (2017). Nudging van rijsnelheid via Dick Bruna-borden: een veldexperiment. De effecten op werkelijk gereden snelheden in vijf gemeenten onderzocht. R-2017-11. SWOV, Den Haag.

[23]. Asmussen, E. (1996). De nieuwe normmens: mens ... maat der dingen: op weg naar integrale veiligheid en toegankelijkheid voor iedereen. Provinciaal Overleg Verkeersveiligheid POV, Zuid Holland, Den Haag.

[24]. Davidse, R.J. (2003). Ouderen en ITS: samen sterk(er)? Literatuurstudie naar de toegevoegde waarde van Intelligente Transportsystemen voor de veiligheid van de oudere automobilist. R-2003-30. SWOV, Leidschendam.

[25]. Michon, J.A. (1989). Modellen van bestuurdersgedrag. In: Van Knippenberg, C.W.F., Rothengatter, J.R. & Michon, J.A. (ed.), Handboek sociale verkeerskunde. Van Gorcum, Assen, p. 207- 231.

[26]. Davidse, R.J., Vlakveld, W.P., Doumen, M.J.A. & Craen, S. de (2010). Statusonderkenning, risico-onderkenning en kalibratie bij verkeersdeelnemers. Een literatuurstudie. R-2010-2. SWOV, Leidschendam.

[27]. Bliss, T. & Breen, J. (2009). Implementing the recommendations of the World report on road traffic injury prevention: country guidelines for the conduct of road safety management capacity reviews and the specification of lead agency reforms, investment strategies and safe system projects. World Bank Global Road Safety Facility, Washington.

[28]. United Nations Road Safety Collaboration (2010). Global plan for the decade of action for road safety 2011-2020. World Health Organisation WHO, Genève.

[29]. Ekman, L. (2017). Vision Zero. Contribution to the European Road Safety Summer School, August 28 - September 1, 2017, Mechelen.

[30]. OECD/ITF (2016). Zero road deaths and serious injuries: leading a paradigm shift to a safe system. Organisation for Economic Co-operation and Development OECD / International Transport Forum ITF, Paris.

[31]. OECD/ITF (2008). Towards zero: ambitious road safety targets and the safe system approach. Organisation for Economic Co-operation and Development OECD/International Transport Forum ITF, Paris.

[32]. Twisk, D.A.M. (2019). Verkeersveiligheid, wiens verantwoordelijkheid is het eigenlijk? Over patriarchale overheden en eigenzinnige burgers. R-2019-31. SWOV, Den Haag.

[33]. Brundtland commision (1987). Our common future: report of the World Commission on Environment and Development. World Commission on Environment and Development, United Nations, Oslo.

[34]. Berg, Y., Strandroth, J. & Lekander, T. (2009). Monitoring performance indicators in order to reach Sweden’s new road safety target – a progress towards zero. Contribution to the 4th IRTAD conference, 16-17 September 2009, Seoul, Korea

[35]. Berg, Y. (2013). Analysis of road safety trends 2012. Management by objectives for road safety work, towards the 2020 interim targets. Publication 2013:178. Swedish Transport Administration, Trafikverket, Borlänge.

[36]. WRR (2017). Weten is nog geen doen. Een realistisch perspectief op redzaamheid. Wetenschappelijke Raad voor het Regeringsbeleid WRR, Den Haag.

[37]. WRR (2014). Met kennis van gedrag beleid maken. Wetenschappelijke Raad voor het Regeringsbeleid WRR, Den Haag.

[38]. Deming, W.E. (1986). Out of the crisis. MIT Center for Advanced Engineering Study, Cambridge.

[39]. ANWB, RAI Vereniging, TLN, NS, et al. (2017). Vooruit! Slimmer, flexibel, groen en veilig. Mobiliteitsalliantie.

[40]. ANWB, AON, Immers, B., Bosch, J.W., et al. (2017). Verkeersveiligheid: een nationale prioriteit; Kiezen voor meer veiligheid en minder slachtoffers. ANWB, Den Haag.

[41]. Wee, B. van & Marchau, V. (2005). De veranderende context voor Duurzaam Veilig. Suggesties voor de beoordeling van maatregelen en het proces. In: Wegman, F. & Aarts, L. (red.), Denkend over Duurzaam Veilig. Essaybundel. SWOV, Leidschendam, p. 136-143.

[42]. Davidse, R.J. (2012). Diepteonderzoek naar de invloedsfactoren van verkeersongevallen. Samenvatting en evaluatie van de resultaten van de pilotstudie diepteonderzoek 2008-2011. R-2012-19. SWOV, Leidschendam.

[43]. Reurings, M.C.B. & Bos, N.M. (2009). Ernstig gewonde verkeersslachtoffers in Nederland in 1993-2008; Het werkelijke aantal in ziekenhuizen opgenomen verkeersslachtoffers met een MAIS van ten minste 2. R-2009-12. SWOV, Leidschendam.

[44]. Tarko, A., Davis, G., Saunier, N., Sayed, T., et al. (2009). Surrogate measures of safety. White paper. Transportation Research Board TRB, Committee on Safety Data Evaluation and Analysis, Subcommittee on Surrogate Measures of Safety, Washington, D.C.

[45]. Aarts, L.T., Loenis, B.J.C., Dijkstra, A., Deden, N.Y., et al. (2016). Risicofactoren nader onderzocht: 50 km/uur-kruispunten. Het concept van Safety Performance Indicators (SPI’s) nader belicht, risicofactoren bij dodelijke ongevallen en kwantificering van roodlichtnegatie. R-2016-17. SWOV, Den Haag.

[46]. Rumar, K. (1999). Transport safety visions, targets and strategies: beyond 2000. Contribution to the 1st European Transport Safety Lecture, Brussel.

[47]. Aarts, L. (2011). Methoden en instrumenten voor het onderbouwen van verkeersveiligheidsbeleid. Een inventarisatie. R-2011-3. SWOV, Leidschendam.

[48]. Heijkamp, A.H. (2001). Duurzaam Veilig: 5 jaar gedemonstreerd. Directoraat-Generaal Rijkswaterstaat, Adviesdienst Verkeer en Vervoer AVV, Rotterdam.

[49]. Terlouw, J.C., Doef, J.C.T. van der, Leemhuis-Stout, J.M., Koning, B.N. de, et al. (2001). Verkeersveiligheid in gedecentraliseerde banen: investeren in cultuur en structuur. Eindrapport. Bevindingen en advies van de visitatiecommissie (commissie Terlouw) naar aanleiding van COVER, de evaluatie van drie convenanten verkeer en vervoer. In opdracht van Directoraat-Generaal Rijkswaterstaat, Adviesdienst Verkeer en Vervoer AVV, in opdracht van Het Nationaal Verkeers- en Vervoersberaad (NVVB). Directoraat-Generaal Rijkswaterstaat, Adviesdienst Verkeer en Vervoer, AVV, Rotterdam.

[50]. Ministerie van VenW, IPO, VNG & UvW (1997). Convenant over het Startprogramma Duurzaam Veilig. Den Haag.

[51]. Ministerie van VenW (2004). Nota Mobiliteit. Deel I: Naar een betrouwbare en voorspelbare bereikbaarheid. Ministerie van Verkeer en Waterstaat, Den Haag.

[52]. Wegman, F. & Aarts, L. (2006). Advancing Sustainable Safety; National Road Safety Outlook for 2005-2020.. SWOV, Leidschendam.

[53]. SWOV (2018). Sustainable Safety 3rd edition – The advanced vision for 2018-2030. Principles for design and organization of a casualty-free road traffic system.. SWOV, Den Haag.

[54]. Ministerie van IenW, Ministerie van JenV, IPO, VNG, et al. (2018). Veilig van deur tot deur. Het Strategisch Plan Verkeersveiligheid 2030: Een gezamenlijke visie op aanpak verkeersveiligheidsbeleid. Ministerie van IenW, het Ministerie van JenV, het Interprovinciaal overleg, de Vereniging van Nederlandse Gemeenten, de Vervoerregio Amsterdam en de Metropoolregio Roterdam Den Haag, Den Haag.

[55]. Weijermars, W. & Wegman, F. (2011). Ten years of sustainable safety in The Netherlands: An assessment. In: Transportation Research Record vol. No. 2213, p. 1-8.

[56]. Weijermars, W.A.M. & Schagen, I.N.L.G. van (2009). Tien jaar Duurzaam Veilig. Verkeersveiligheidsbalans 1998-2007. R-2009-14. SWOV, Leidschendam.

[57]. Janssen, S.T.M.C. (red. 1997). Functionele eisen voor de categorisering van wegen. Eerste stap naar een handleiding voor duurzaam-veilige wegcategorieën. R-97-34. SWOV, Leidschendam.

[58]. Vissers, J.A.M.M., Nägele, R.C., Kooistra, A.B., Betuw, A.J.M. van, et al. (2005). Leerdoelendocument Permanente Verkeerseducatie. In opdracht van Directoraat-Generaal Rijkswaterstaat, Adviesdienst Verkeer en Vervoer AVV. Traffic Test, Veenendaal.

[59]. Goldenbeld, C., Popkema, M. & Wildervanck, C. (2008). Verkeershandhaving. In: Handboek verkeersveiligheid, Publicatie No. 261. CROW, Ede, p. 343-382.

[60]. Weijermars, W.A.M. & Aarts, L.T. (2010). Duurzaam Veilig van theorie naar praktijk. Verkenning van barrières bij de implementatie van Duurzaam Veilig. R-2010-23. SWOV, Leidschendam.

[61]. Wegman, F.C.M. (2010). De prijs van water bij de wijn. Intreerede 27 januari 2010 ter gelegenheid van de aanvaarding van het ambt van hoogleraar Verkeersveiligheid aan de faculteit Civiele Techniek en Geowetenschappen van de Technische Universiteit te Delft. TU Delft, Faculteit Civiele Techniek en Geowetenschappen, Delft.

[62]. Vägverket (2009). Management by objectives for road safety work. Analysis of the road safety development. Result Conference 2009. Publikation 2009:113. Swedish Road Administration (Vägverket), Göteborg.

[63]. Hughes, B.P., Anund, A. & Falkmer, T. (2015). System theory and safety models in Swedish, UK, Dutch and Australian road safety strategies. In: Accident Analysis & Prevention, vol. 74, p. 271-278.

[64]. Bax, C.A., Aarts, L.T. & Meilink, R. (2014). Veranderde risico-acceptatie in verkeersveiligheid: een praktische uitwerking in ProMeV. Contribution to the Colloquium Vervoersplanologisch Speurwerk, 20 en 21 November 2014, Eindhoven.

[65]. Reijnen, L.H. (2017). Kader verkeersveiligheid: kader voor het borgen van verkeersveiligheid bij aanleg- en onderhoudsprojecten op het Rijkswegennet. Deel A: hoofddocument + Deel B: methodieken en achtergrondinformatie. Ministerie van Infrastructuur en Milieu, Rijkswaterstaat, Water Verkeer en Leefomgeving, Delft.

[66]. IPO (2014). ProMeV: proactief meten verkeersveiligheid. Interprovinciaal Overleg IPO Den Haag.

[67]. Gemeente Amsterdam (2016). Meerjarenplan verkeersveiligheid 2016-2021. Gemeenteraad, Verkeer en Openbare Ruimte, Amsterdam.

[68]. ETSC (2001). Transport safety performance indicators. European Transport Safety Council ETSC, Brussel.

[69]. Aarts, L.T. (2018). Prestatie-indicatoren voor verkeersveiligheid (SPI’s). Een overzicht van de kennis op dit moment over SPI’s als basis voor risicogestuurd beleid. R-2018-19. SWOV, Den Haag.

[70]. Aarts, L.T. (2016). Risicogestuurd verkeersveiligheidsbeleid. Wat is het en wat kun je ermee? Contribution to the Nationaal Verkeersveiligheidscongres NVVC 2016, 21 april 2016, Den Bosch.

[71]. Lindberg, J., Darin, L. & Berg, Y. (2012). Review of interim targets and indicators for road safety in 2010–2020: Analytic report. Publication 2012:162. Swedish Transport Administration (Trafikverket), Borlänge.

[72]. Monderman, H. (2004). Weg van het landschap; Wegen voor mensen. Programmabureau Weg van het landschap, Groningen.

[73]. Hamilton-Baillie, B. (2008). Shared Space. Final evaluation and results. Keuninginstituut, Provincie Friesland, Leeuwarden.

[74]. CROW (2011). Duurzaam Veilig en Shared Space: een vergelijking. CROW, Ede

3 + 5 =
Solve this simple math problem and enter the result. E.g. for 1+3, enter 4.

Would you like to cite this fact sheet?

SWOV publication

This is a publication by SWOV, or that SWOV has contributed to.