Trucks and delivery vans

Updated

From 2009 to 2018, an annual average of 80 road deaths were attributable to crashes with trucks and 67 road deaths to crashes with delivery vans. Casualty numbers are higher among crash opponents than among occupants of trucks or delivery vans. The fatality rate among crash opponents is higher when they crash into a truck or delivery van than when they crash into a car. The fatality rate among occupants of a truck or delivery van, however, is lower than among car occupants. Among the occupants of trucks or delivery vans, most fatalities occurred on provincial road and on national roads. In crashes with trucks, most fatalities among crash opponents occurred on provincial roads, while in crashes with delivery vans most fatalities occurred on 50km/h roads. For trucks, head-on crashes without overtaking manoeuvres are the most common crashes. For delivery vans, side impact crashes at intersections or head-on crashes without overtaking manoeuvres are most common. It is remarkable that rear-end collisions with a stationary vehicle and right side impact collisions are relatively more common for trucks and delivery vans (e.g. blind spot crashes) than for cars. Important factors contributing to crashes with trucks and delivery vans are the driver’s often young age, fatigue, distraction and task load, and burst tyres or unbalanced/too heavy loading of the vehicle, and insufficient awareness of truck characteristics among other road users. Research shows that drivers of transport companies with a proper safety culture may drive more safely. Measures to prevent crashes with trucks or delivery vans lie within the domain of vehicle measures (e.g. implementing blind spot detection and alert systems), legislation and enforcement (e.g. concerning fatigue and distraction), logistics (such as separating heavy goods vehicles and lighter vehicles/pedestrians) and information and education campaigns (paying attention to dealing with burst tyres during basic driver training and refresher training).

What do we mean by trucks and delivery vans?

Within the European Union, the following vehicle categories are used for trucks and delivery vans [1]:

  • N1: Motor vehicle for the carriage of goods having a maximum mass[i] not exceeding 3,500 kg (delivery vans).
  • N2: Motor vehicle for the carriage of goods having a maximum mass exceeding 3,500 kg but not exceeding 12,000 kg (trucks).
  • N3: Motor vehicle for the carriage of goods having a maximum mass exceeding 12,000 kg (trucks).

Trucks

In the Dutch Traffic Code (Reglement Verkeersregels en Verkeerstekens (RVV)), trucks are defined as ‘motor vehicles not equipped for transporting passengers, having a maximum mass exceeding 3,500 kg’ [2]. Trucks may consist of different configurations with varying maximum lengths[ii] (Article 5.3.6 in [3]).

Since 1 January 2013, the Longer and Heavier Truck combination (LHT) has had legal status, which implies that LHTs may drive on designated roads in the Netherlands (Article 13 of the Dutch policy rule concerning approval and exemption of LHTs [4]). Driving LHTs implies lower costs and a reduction of CO2 emission [5]. The roads on which LHTs are allowed to drive are motorways and designated other roads. The trucks are meant to drive to and from industrial areas and will therefore not drive in 30km/h zones and home zones. The trucks are not allowed to overtake, cannot cross at level crossings for trains exceeding 40 km/h speeds, and drivers are obliged to complete an additional training course. Apart from the extra length the trucks can be recognised by a sign on the back of the truck showing an outline of the LHT with the words ‘Let op! Extra lang!’ (‘Caution! Extra long!’), or specifying its length in meters.

Delivery vans

Delivery vans are defined as ‘motor vehicles for the carriage of goods having a maximum mass not exceeding 3,500 kg’ [6]. Thus, the main difference between a truck and a delivery van is weight. Delivery vans may have strongly differing sizes and shapes. Figure 1 shows a number of vehicles classified as delivery vans.

Figure 1. Delivery van types. Copied from [7].

For delivery vans, the European vehicle category is N1. However, dependent on usage and number plate, the same type of vehicle may fall within a different category, M1 or N1 for instance if it is meant for passengers or goods respectively (see [8] for the requirements of this distinction imposed by the Dutch Tax Authority). Moreover, it is striking that larger vans have a relatively large load compartment, which according to the technical specifications exceeds the maximum mass allowed for N1 vehicles, thereby increasing the risk of overloading.


[i] Maximum mass refers to the construction mass combined with the maximum load of the vehicle.

[ii] Maximum length and width are mentioned, excluding possible overhanging loads. This does not apply to exceptional transport.

How many trucks and delivery vans are there in the Netherlands, and how many kilometres do they travel on public roads?

On January 1st 2019, there were over 143,000 trucks (box trucks and tractor-trailer combinations) and 914,000 delivery vans with a Dutch registration plate [9]. In 2018, the number of kilometres they drove on Dutch roads amounted to 6.5 billion for trucks and 17.6 billion for delivery vans (Table 1). The figures show that cars outnumber trucks and delivery vans but that, in the Netherlands, trucks and delivery vans travel more kilometres per vehicle: trucks (box trucks and tractor-trailer combinations) travel 3.7 times and delivery vans 1.6 times more kilometres than cars. The number of kilometres travelled on Dutch roads by Dutch and foreign trucks and delivery vans was respectively 7.4 and 18.4 in 2018. The number of foreign trucks and delivery vans in the Netherlands is unknown.

Type of vehicle

Number of Dutch vehicles in January 2019 [9]

Number of kilometres travelled in 2018 [10]


Dutch vehicles

Foreign vehicles

Total

Box truck

62,963

2,028

148

2,176

Tractor (for semitrailer or centre axle trailer)

80,078

4,467

750

5,218

Semitrailer

164,012


Centre axle trailer

1,008,731


Delivery van

914,766

17,639

773

18,412

Car

8,530,584

104,736

5,449

110,185

Table 1. Number of vehicles with a Dutch registration plate and number of kilometres travelled in the Netherlands, by vehicle type. Note: the number of kilometres travelled are preliminary data for 2018.

There are no data about the number of kilometres travelled by road type. However, the regulations say that Longer and Heavier Truck combinations (LHT) are not allowed to drive on all roads: they are only allowed on the main road network and on designated roads. Thus, they can never drive on roads with maximum speeds of 30km/h or lower.

Connekt [11] has studied the use of delivery vans in the Netherlands. The study showed that 2.6% to 4.6% of the kilometres travelled were in aid of home deliveries of internet orders. E-commerce sales were shown to increase by 15 to 20% annually. This increase is reflected in the number of delivery van kilometres, but its impact on the total number of delivery van kilometres is limited since these e-commerce-related kilometres are only a small part of the total number.

What is the annual number of casualties of crashes with trucks and delivery vans?

In crashes with trucks, an annual average of 80 road deaths were registered[i] from 2009 to 2018; an average of 6 truck occupants and 74 occupants of crash opponents. In crashes with delivery vans, an annual average of 67 road deaths were registered in that same period; an average of 18 van occupants and 49 occupants of crash opponents. The number of serious road injuries in truck and delivery van crashes is unknown. Since 2009, reliable figures have not been available (also see SWOV fact sheet Serious road injuries in the Netherlands).

Table 2 shows the number of annually registered road deaths on account of crashes with trucks and delivery vans. It also shows that considerably more road deaths are registered among the ‘crash opponents’ than among the truck and van occupants themselves. Moreover, Table 2 implies that crashes with trucks or delivery vans make up about one quarter of the total number of registered road deaths and that this share remains steady.


2009

2010

2011

2012

2013

2014

2015

2016

2017

2018

Truck

Occupants

4

4

3

7

7

6

10

6

8

7


Crash opponents

91

76

74

66

78

69

66

70

64

81

Delivery van

Occupants

24

22

18

16

15

7

15

24

21

21


Crash opponents

65

47

57

52

43

35

33

58

49

50

Total number of registered road deaths with trucks or delivery vans (excl. overlap)

170

138

142

135

133

113

122

142

132

147

Share in total number of registered road deaths

26%

26%

26%

24%

28%

24%

23%

27%

25%

25%

Table 2. Number of registered road deaths involving trucks and/or delivery vans, including crashes in which these vehicle types are involved as third parties, broken down by truck/delivery van occupants and occupants of crash opponents. Crashes involving both a delivery van and a truck are only included once. Source: Ministry of Infrastructure and Water Management (Dutch: IenW) – Database of Registered Crashes in the Netherlands (Dutch: BRON).


[i] The number of registered road deaths is lower than the actual number of road deaths. Also see SWOV fact sheett Road deaths in the Netherlands

What is the crash rate for trucks and delivery vans?

Figure 2 shows that the fatality rate for crash opponents of trucks is 7.5 times higher than for crash opponents of cars and 3.6 times higher for crash opponents of delivery vans. Furthermore, the fatality rate of crash opponents of delivery vans is 2.1 times higher compared to cars. Below we describe how these figures were calculated.

Figure 2. The fatality rate (average over 2009-2018) is defined as the number of deaths among occupants and among crash opponents per billion kilometres travelled by trucks, delivery vans and cars. In the calculation of the fatality rate, the motorvehicle kilometres travelled by the crash opponent were not taken into account  (BRON- IenW; Statistics Netherlands - CBS, 2019). Note that the risk calculations are based on preliminary numbers of kilometres travelled in 2017 and 2018.

In the Netherlands, there are over six times as many delivery vans as there are trucks (see Table 1 below the question How many trucks and delivery vans are there in the Netherlands and how many kilometres do they travel on public roads?). Table 2 (see the question What is the annual number of casualties of crashes with trucks and delivery vans?), however, shows that the fatalities among crash opponents of trucks outnumber those of delivery vans. One of the causes is that trucks travel more kilometres per vehicle. Furthermore, more foreign trucks than foreign delivery vans travel Dutch roads. Consequently, the number of kilometres travelled by delivery vans is only 2.4 times higher than that travelled by trucks and tractors. Therefore, we use the number of road deaths per billion kilometres travelled by domestic and foreign trucks or delivery vans in the Netherlands to measure the fatality rate, instead of the number of road deaths per billion vehicles. Figure 2 shows these fatality rates for the crash opponents of trucks and delivery vans, compared to the fatality rate of crash opponents of cars.

Where do crashes with trucks or delivery vans take place?

Trucks

As mobility data by road type are unavailable, it is impossible to determine the fatality rate by road type. Therefore, we only mention the number of registered road deaths by road type. Figure 3 shows that, for all road types, road deaths among crash opponents of trucks outnumber road deaths among truck occupants. Most road deaths among crash opponents occur on provincial roads (an annual average of 20), followed by urban 50km/h roads and national roads (an annual average of 16 and 14 respectively). Most road deaths among truck occupants occur on national roads (an annual average of 4).

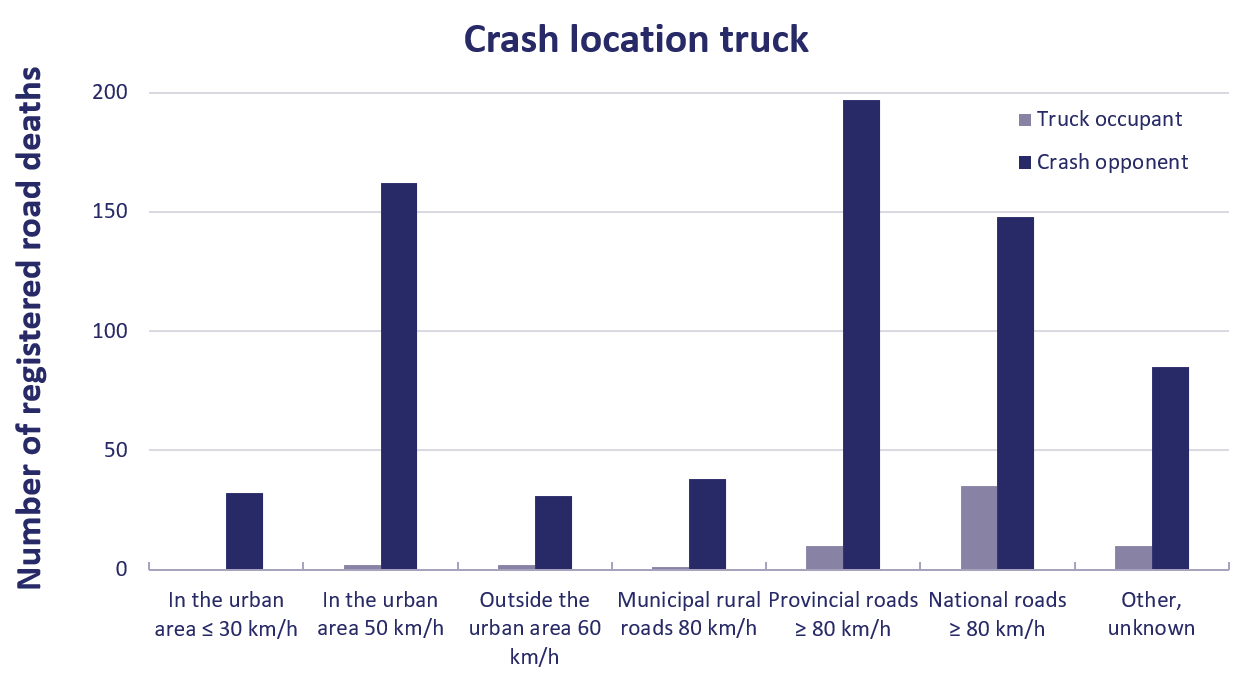
Figure 3. The number of registered road deaths among truck occupants and among crash opponents from 2009 to 2018 by road type. Primary collision party only (BRON, IenW).

Delivery vans

Figure 4 shows that for delivery vans differences between crash locations and casualties among occupants or crash opponents are less marked. The main exception concerns urban 50km/h roads, where the number of road deaths among crash opponents (an annual average of 13) is much higher than among delivery van occupants (an annual average of 1). Most road deaths among delivery van occupants occur on provincial roads and on national roads (an annual average of 4-5 deaths), while most road deaths among crash opponents occur on urban 50 km/h roads.

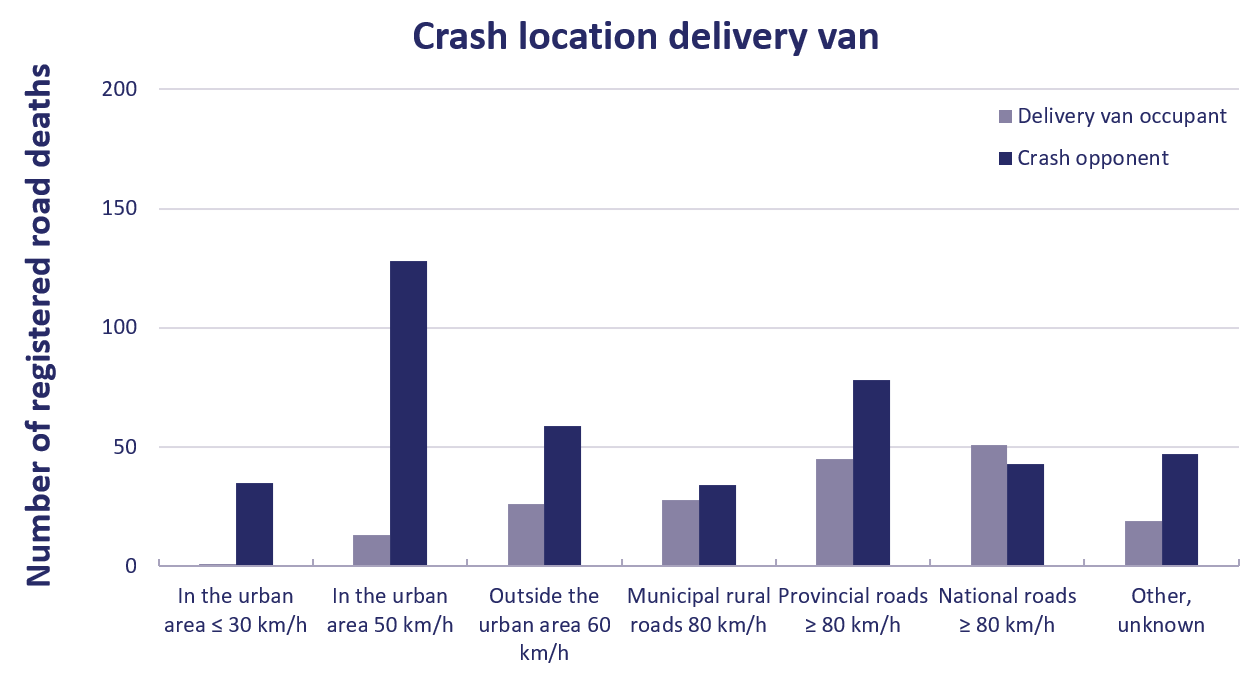
Figure 4. The number of registered road deaths among delivery van occupants and among crash opponents from 2009 to 2018 by road type. Primary collision party only (BRON, IenW).

In what type of crash are trucks and delivery vans often involved?

Most crashes with delivery vans are side impact collisions on intersections (where both vehicles drive straight ahead) or head-on collisions without lane changes (both vehicles driving straight ahead), see Figure 5.a, 5.b and Table 3. For trucks, head-on collisions without lane changes are most frequent. These crashes are also relatively frequent for cars. It is remarkable that for trucks and delivery vans rear-end collisions with a stationary vehicle and right side impact collisions (with a stationary vehicle or when turning right) relatively outnumber these kinds of crashes for cars. (Figure 5.c, 5.d, 5.e). Right side impact collisions when turning right concern the well-known blind spot crashes (also see the question How big is the ‘blind spot problem’ and what can be done? ). In addition, sideswipe collisions (figure 5.f) for trucks outnumber this kind of collision for both delivery vans and cars.

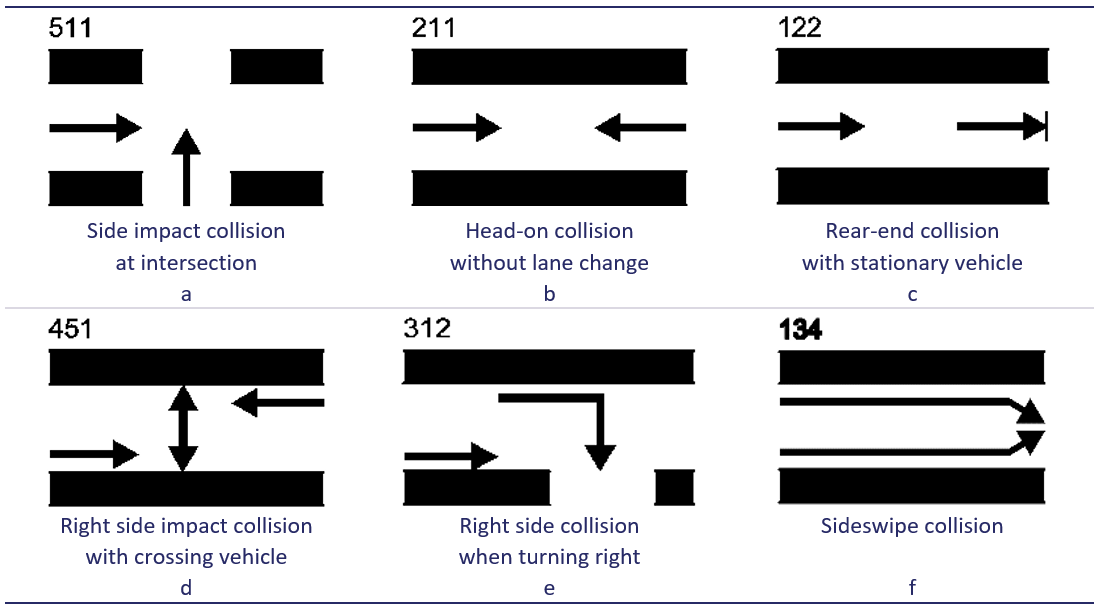
Figure 5. Diagram of common collisions of delivery vans or trucks, both within transport mode (a, b) and with cars (c, d, e, f). [12].

Position

Trucks


Delivery vans


Cars


Manoeuvre

Number

Manoeuvre

Number

Manoeuvre

Number

1

Head-on without lane change

111

Side impact collision at intersection

59

Collision with tree and other solid objects

596

2

Other side impact collisions 

65

Head-on without lane change

59

Head-on without lane change

294

3

Side impact collision at intersection 

55

Collision with tree and other solid objects 

54

Side impact collision at intersection

269

4

Rear-end without turning

50

Rear-end without turning

44

Other side impact collisions

217

5

Other

37

Other side impact collisions

42

Rear-end without turning

118

6

Rear-end with stationary vehicle

23

Rear-end with stationary vehicle

19

Not off the road

117

7

Left side impact, turning left 

23

Other

16

Collision with other road furniture 

91

8

Sideswipe

19

Right side impact with crossing vehicle 

15

Other

83

9

Right side impact, turning right[i]

16

Left side impact, turning left

15

Pedestrian on pavement or roadside 

78

10

Pedestrian on pavement or roadside

16

Collision with other road furniture

14

Left side impact, turning left

72

Table 3. Top 10 of manoeuvres with the highest number of registered road deaths from 2008 to 2014[ii] for trucks, delivery vans and cars respectively. Manoeuvres in bold do occur in the case of trucks and/or delivery vans, but not in the case of cars (BRON – IenW).

Based on three in-depth Belgian studies of fatal and non-fatal crashes with trucks, Temmerman et al. [13] identified four common crash types. About 25% of the crashes studies were rear-end collisions, mainly in traffic jams. 20% were blind spot crashes between trucks and vulnerable road users, mainly the blind spot on the right for trucks turning right. Over 15% were side impact collisions at intersections. Finally, almost 10% were crashes involving lane departure, such as unintentional lane departures or errors during overtaking manoeuvres. At European level, the ETAC in-depth study [14] describes the following four common crash types in fatal and non-fatal crashes with trucks: crashes at intersections (27%), rear-end collisions (21%), crashes on account of lane departure (11%) and single truck crashes (7%).

Based on an in-depth study of inter-urban crashes in the Netherlands with delivery vans, Davidse and Van Duijvenvoorde [15] identified five common crash types:

  • Reversing driver collides with a vulnerable crash opponent that the driver did not see (on account of the enclosed cab);
  • Driver turning right does not see cyclist/light moped rider going straight ahead (blind spot crash);
  • Driver is not alert to crossing traffic;
  • Driver and crossing traffic cannot see each other because the sight distance is inadequate;
  • Driver enters a confusing traffic situation which calls for special attention.

[i] The ‘right side impact, turning right’ category includes, among others, blind spot crashes.

[ii] This period was chosen because, from 2015 onwards, by far most crash manoeuvres have been registered as ‘other’ or ‘other single’, which implies no reliable conclusions may be drawn

What are the major causes of (serious) crashes with trucks and delivery vans?

Important contributory factors of crashes with trucks and delivery vans are the driver’s age, fatigue, distraction and task load, burst tyres, unbalanced or too heavy vehicle loads, and other road users’ insufficient awareness of truck characteristics.

Age

Young, novice drivers have a higher crash risk than older, more experienced drivers (see SWOV fact sheet 18- to 24-year-olds: young drivers. This particularly applies to drivers of delivery vans. Starren et al. [16] conclude that drivers of delivery vans are often young, have little driving experience and have a higher risk acceptance. Bos and Twisk [17] find that young novice drivers of delivery vans are more often involved in crashes with oncoming traffic, in which the front of the delivery van hits the crash opponent. They are also more often involved in rear-end crashes in which the delivery van is hit from behind; possibly because of unpredictable behaviour.

Fatigue

There are indications that truck drivers are relatively more often involved in fatigue-related crashes than car drivers ([18] [19] [20]; also see SWOV fact sheet Fatigue). Questionnaire studies have found that falling asleep behind the wheel is related to a truck driver’s personal characteristics, such as poor physical fitness and overweight [20] and with working conditions, such as driving long uninterrupted hours and not having a permanent employment contract [21]. The Dutch Safety Board notes that a lack of adequate rest facilities along motorways contributes to driving too many hours, which may lead to fatigue [22].

Distraction and task load

Drivers of trucks and delivery vans are often held to a tight schedule (delivery windows, appointments with customers) and, while driving, they have regular telephone contacts about the delivery of goods for and appointments with customers [16]. This distracts them from the driving task. An American study using naturalistic driving methods [23] showed that distraction contributed to crash circumstances in 71% of the crashes with trucks. On the basis of several international studies, Temmerman et al. [13] conclude that distraction is a contributory factor in 5 to 51% of the crashes with trucks and note that this margin is probably caused by the absence of a universal unambiguous definition of the concept of distraction. There are no figures about the involvement of distraction in crashes with trucks in the Netherlands. Yet, the UDRIVE naturalistic driving study among Dutch truck drivers [24] shows that they are occupied with other tasks during 20% of the time while driving, such as phone use (5%) and use of other electronic devices (1%). For more information, see SWOV fact sheet Distraction in traffic.

Task load presumably contributes to crashes, both from the workload and information processing perspectives. A study by Kuiken et al. [25] of crashes with trucks on motorways shows that 80% of the drivers questioned is sometimes or often in a hurry while driving. Time pressure is partly due to employer and customer demands, and may lead to a driver’s unsafe driving behaviour [26]. Figures showing the crash risk due to heavy workload are unavailable however.

Mirrors and cameras around the vehicle allow drivers to see more and more, but they are not always able to process all the different information simultaneously and on time.  In 30% of the blind spot crashes in 2006 and 2007, a too heavy workload is mentioned as one of the main factors causing such crashes [27].

Burst tyres

According to the Dutch Safety Board, burst tyres may be caused by contact with a (sharp) object, overloading and/or under-inflation [22], as was shown by their 2012 study of fatal truck crashes on national roads from 2007 to 2011. A burst tyre was the cause of 3 out of 48 (6%) truck crashes. How often burst tyres result in (fatal and non-fatal) crashes is unknown, because this is not included in the crash database of registered crashes in the Netherlands (BRON).

Load

The crash risk on account of too heavy loads of trucks and delivery vans appears to be small, but the risk of a serious crash outcome in case of too heavy or unbalanced loads is higher [28].A European in-depth study (ETAC) of the cause of 624 truck crashes identified ‘load’ (loss of load,  overload, unbalance of the load, insufficient safety measures with regard to load) as the main cause of 9 crashes (1.4%) [14]. Foreign studies show that unbalanced or too heavy loads contribute to delivery van crashes outside the urban area, in particular to crashes in which the driver loses control of the vehicle [29] [30]. In a Dutch in-depth study of 60 delivery van crashes, only two of the vehicles studied were shown to carry too heavy loads. These load characteristics did not, however, contribute to delivery van crashes in the urban area [31]. On urban roads, driving speeds are lower, so that unbalanced or too heavy loads are less likely to cause crashes than outside the urban area.

Other road users

Other road users are often not fully aware of the characteristics of trucks and delivery vans, nor how they should deal with them. Examples are the large blind spots around trucks and the longer braking distance of trucks and delivery vans, particularly when they carry heavy loads. In 64% of the 624 crashes studied, the cause proved to be (partly) attributable to the behaviour of other road users, such as speeding, not complying with priority rules, too short headway distances, or distraction [14].

How big is the ‘blind spot problem’ and what can be done?

From 2008 to 2016[i], an annual average of eight to nine road deaths were attributable to blind spot crashes with a truck and two road deaths to blind spot crashes with a delivery van. Possible measures to prevent blind spot crashes are separating vulnerable road users from trucks, developing detection systems, and information and education campaigns for truck drivers and vulnerable road users.

The blind spot problem is usually taken to imply that it is hard to see vulnerable road users in front of or to the right side of the truck cabin. Correctly adjusted mirrors (including blind spot mirrors in front of and to the right side of the cabin) should allow the truck driver to directly or indirectly see the entire space around the cabin, with the exception of the area behind the A pillars of the truck. However, seeing that drivers have to look at several mirrors, windscreens and possible camera systems to obtain the most complete picture possible they will have trouble seeing everything at once. From 2008 to 2016, if we observe the selection of blind spot crashes by the Ministry of Infrastructure and Water Management, an annual average of 8-9 road deaths were attributable to blind spot crashes with a truck (of which 6-7 were cyclists) and 2 road deaths to blind spot crashes with a delivery van. In the Netherlands the problem is bigger for cyclists than for pedestrians. Therefore, Dutch studies mainly focuses on crashes between trucks and cyclists. The report by Schoon, Doumen and de Bruin [32] (see Figure 6) describes three common scenarios.

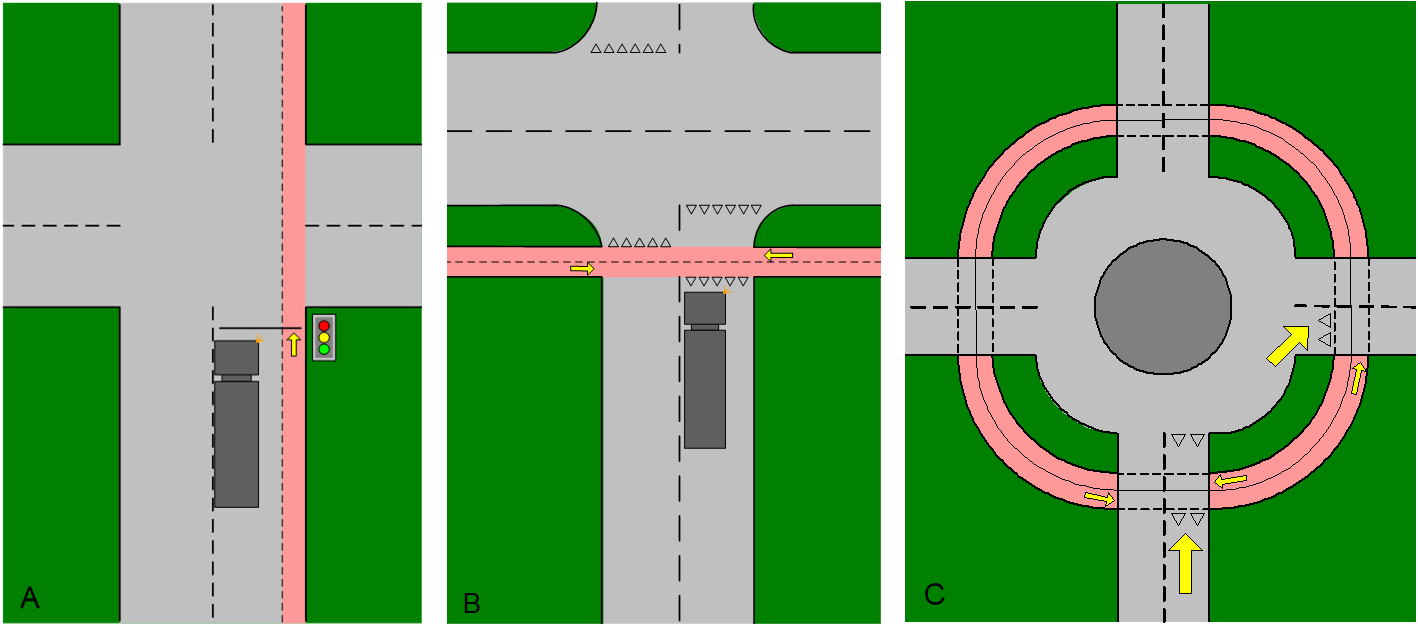
Figure 6. Three common situations in which conflicts arise between trucks (presented as large yellow arrows) and cyclists (small yellow arrows). A. At an intersection (with traffic lights), the truck starts from a stationary position and turns right; the cyclist rides straight ahead. B. The truck approaches a priority road with a separate bicycle path (two-way traffic). C. Entering or driving on a roundabout where cyclists have priority. When a truck enters the roundabout, the situation corresponds to situation B, when leaving the roundabout with situation A (source: [32])

In all cases, the cyclist driving straight ahead takes priority (when the traffic light is green) over the truck. However, the cyclist is regularly overlooked by the truck driver. This may be due to field of vision problems (no or incorrectly adjusted mirrors or objects on the driver’s dashboard) or a too heavy task load (turning right asks too much of the driver’s mental capacity because it is a complex situation). At the same time, the cyclist does not realise that the truck driver does not see him or that the truck driver intends to turn right.

From 2010 to 2016, the number of blind spot crashes among cyclists has remained below 10. In previous years, the annual number of fatal blind spot crashes among cyclists was 10 to 20, with the exception of 2002 and 2003 when the blind spot mirror had just been introduced, accompanied by a lot of publicity about the blind spot of trucks. The decrease of the number of fatal blind spot crashes may be a consequence of EU legislation concerning a mandatory field of vision around trucks and of information and education campaigns for cyclists. In addition, ‘focus on the blind spot’ has been included in the list of elements to be assessed during truck driver training. However, an explicit procedure about how and when the truck driver has to look into the mirrors is does not exist. Blind spot crashes can be prevented if trucks and vulnerable road users do not encounter each other on the road, for example by means of a separate infrastructure for heavy goods vehicles (separation in space) or by setting delivery times (separation in time). Other solutions reducing the crash risk are the use of a cycle box at traffic lights (where cyclists wait in front of a truck instead of to the right of the cabin), developing blind spot detection systems that are reliable in timely support and/or intervention, continuing information and education campaigns for vulnerable road users, and more explicit focus on the blind spot during truck driver training [33].


[i]. Since 2017 it has no longer been possible to determine the number of road deaths attributable to blind spot crashes, because specific road user manoeuvres are no longer registered. Since 2009, there have not been (reliable) figures of serious road injuries attributable to blind spot crashes.

Will the increase in online shopping result in unsafer neighbourhoods?

With the present crash registration, a quantitative effect of internet shopping on neighbourhood safety cannot be determined. We do, however, expect that the increase in delivery traffic in neighbourhoods will result in less road safety, because the risk for the crash opponents is greater in the case of a delivery van crash than in the case of a car crash. Also see the question What is the crash rate for trucks and delivery vans?

More and more people shop online. In the Netherlands, the percentage of online shoppers aged between 16 and 74 grew from 55% in 2007 to 80% in 2018 [34]. In principle, this increase affects mobility, although the extent of the effect is not exactly known. On the one hand, we can do our shopping from home, which should reduce mobility in our neighbourhood. Online shopping does, on the other hand, generate mobility, because the products ordered need to be delivered, picked up and possibly returned. Most products ordered online are delivered to our doors, which results in an increased delivery van mobility in our neighbourhoods. Yet, Connekt [11] indicates that only 2.6 to 4.6% of the number of kilometres travelled is travelled by delivery vans for home delivery of products ordered online. Thus, the effect of increased delivery van mobility on account of online shopping on the total number of kilometres travelled by delivery vans is limited.

What are the requirements for drivers of trucks or delivery vans?

Delivery van drivers have to comply with the same requirements as car drivers. For driving a truck the requirements are different, however: obtaining a C-, C1-, CE- or CE1 licence, refresher training for professional drivers (Code 95) every five years, and strict rules about driving time and rest periods. The requirements for driving a truck are briefly explained below.

Licence for driving a truck

The Dutch Driving Test Organisation provides the following overview of the requirements of the driving licence for truck drivers [35].

Driving licence

Professional    transport

Minimum age

Maximum mass allowed

Maximum trailer mass exceeding  750 kg?

C1

No

18

3500 - 7500 kg

No

C

21

> 3500 kg

No

C1E

18

3500 - 7500 kg

Yes, to a combined maximum of  12,000 kg

CE

21

> 3500 kg

Yes

C1 with code 95

Yes

18

3500 - 7500 kg

No

C with code 95

> 3500 kg

No

C1E with code 95

3500 - 7500 kg

Yes, to a combined maximum of 12,000 kg

CE  with code 95

> 3500 kg

Yes

Table 4. Licence types as a function of professionalism, age and mass. Licences CE and CE with code 95 contain no restrictions concerning maximum combined mass.

There are four licence types for truck drivers: C, C1, CE and C1E. To these licences, code 95 may be added. The difference between the C1 and C licence is that a C1 licence only allows the driver to drive lighter trucks (up to 7,500 kg). Adding E to the licence implies that the driver is also allowed to drive with a (semi)trailer of more than 7500 kg. A truck driver earns Code 95 after he has obtained the initial qualification; this code on the driving licence allows a truck driver to drive professionally. The truck driver needs to renew the code every five years by doing a refresher training (of at least 35 hours). An 18-year-old truck driver is only allowed to drive lighter trucks provided he has obtained the correct licence. If said driver has obtained the initial qualification (code 95), he is also allowed to drive heavier trucks (> 3500 kg). Without initial qualification this is only allowed for truck drivers aged 21 or over.

For driving a Longer and Heavier Truck (LHT) the driver needs to obtain a special certificate. This entails an exam with a theoretical and practical component. When taking the exam, the driver needs to have a valid CE driving licence with code 95, and five years of experience in driving CE-combinations, and his licence must not have been suspended in the previous three years.

Refresher training

As described above, a professional driver needs to undergo refresher training every five years, for a minimum of 35 hours. The driver may choose the training course at certified institutions himself, as long as the minimum number is guaranteed. In the Netherlands, examples of training courses to choose from are: energy-efficient driving, manoeuvring, and driving optimisation [36] .

Driving time and rest periods

EU regulation 561/2006 [37] lays down the legal driving time and rest period requirements for truck drivers. The regulation says that the uninterrupted driving time may not exceed 4.5 hours, after which a 45-minute break is obligatory. The daily and weekly driving time may not exceed 9 and 56 hours respectively. Once a week, truck drivers are obliged to take a rest of 45 uninterrupted hours. Spending this rest period inside the truck cabin is illegal. The exact rules are published in [38]. In the Netherlands, the EU rules have been included in article 2.5:3 of the road carriage working hours decree (Arbeidstijden besluit vervoer) [39].

There are, however, doubts about the effectiveness of driving time and rest period legislation. In 2012, the Dutch Safety Board concluded that employers fail to take legal responsibility for scheduling the truck drivers’ work in such a way that they can comply with the mandatory driving time and rest period regulations [22]. For more information, see the question What vehicle measures were taken and how effective were they? .

What is a safety culture and how effective is it?

A company’s safety culture can be described as the shared safety values and standards within a company [40]. Research shows that improving the safety culture often results in safer driving behaviour of the company’s drivers.

Schein [41] concludes that a safety culture is expressed in (formalised) instructions, procedures and measures and in everyday habits, conduct and external company features (and company materials), see Figure 7.

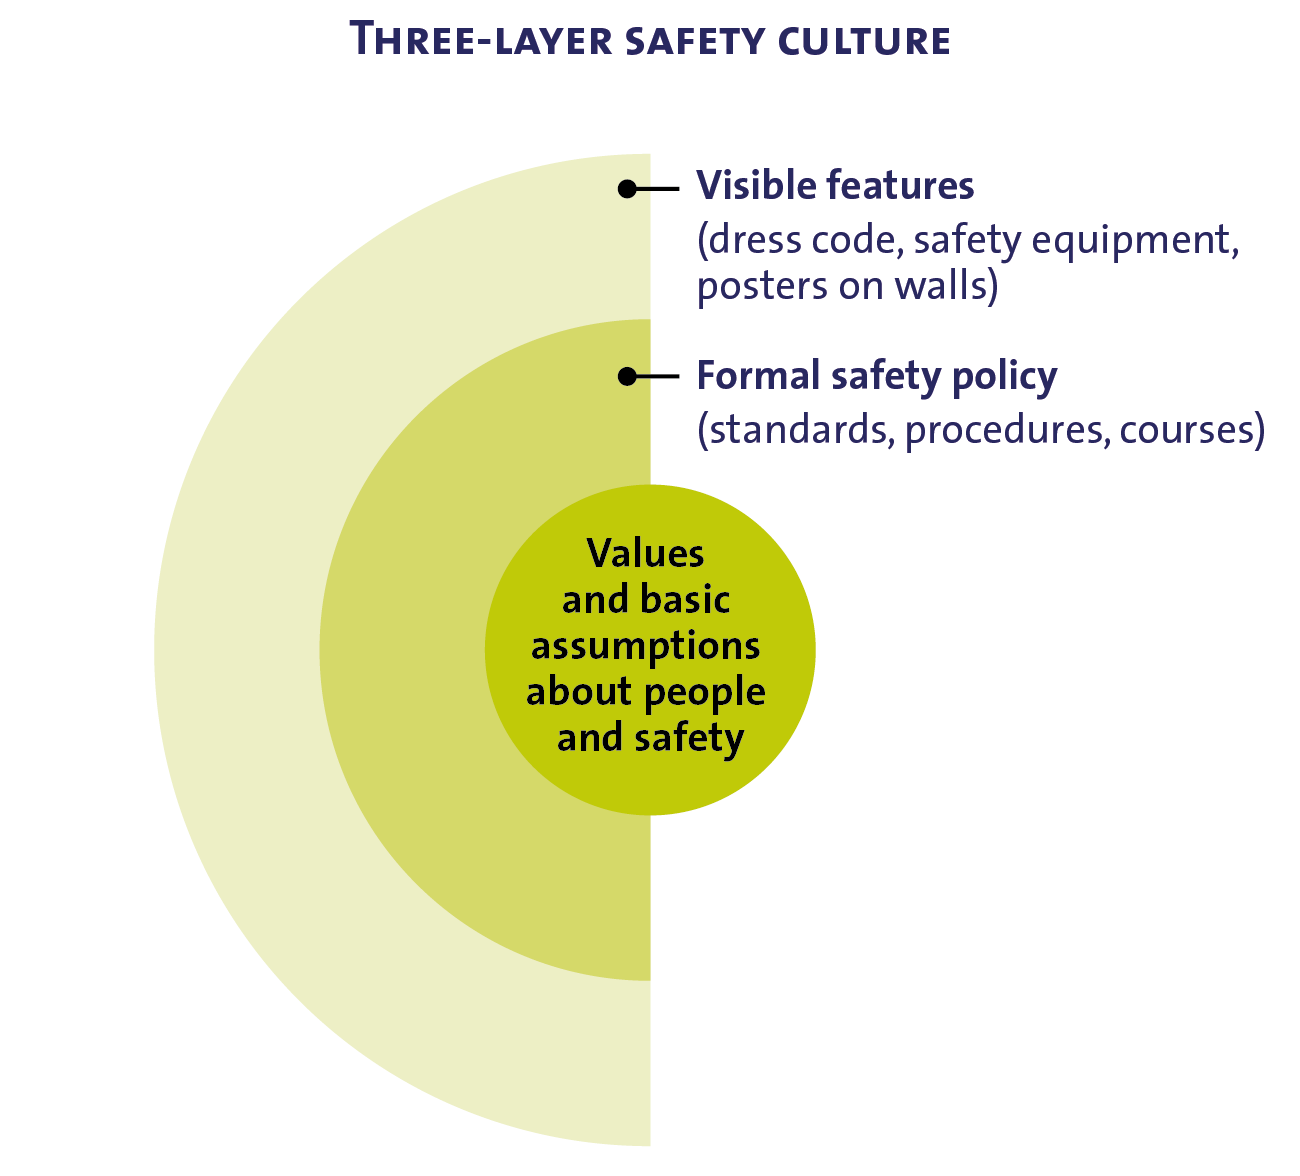
Figure 7. A company’s safety culture has three layers [41]

Companies may be characterised by five different kinds of safety culture [42]. Companies with a ‘pathological’ or ‘reactive’ safety culture hardly attach any importance to safety, or no importance at all. Legal requirements are only met when the probability of detection is deemed to be high, or safety measures are not taken until an accident has occurred. Companies with a ‘calculating’, ‘proactive’, or ‘progressive’ safety culture increasingly attach importance to safety. These companies often have damage prevention programmes including measures to prevent costs of damage to vehicles. Cost reductions, the company image and customer requirements may encourage a company to take a preventive approach.  

Most studies show that drivers drive more safely if their employers have improved their safety cultures [40]. There are indications that group discussions about safety, training of high-level skills (risk and hazard perception, risk adjustment) and rewarding safe driving behaviour contribute to crash reduction. For transport companies, damage prevention plans result in a reduction of claims [43]. In practice, however, not all companies have a safety culture. For small companies in particular, investments in training (young) drivers are meagre [33].

What vehicle measures were taken and how effective were they?

For trucks, the following vehicle measures have been taken: open side shields, blind spot mirror, 90 km/h speed limiters, presence and usage of seat belts, retroreflective contour marking, Automatic Emergency Braking (AEB) system and Lane Departure Warning (LDW) system. The effective date and effectiveness of the measures are presented in Table 5.

Measure

Legislation

Effectiveness

Open side shields

1998: Article 5.3.48 in [3]

A side shield may prevent vulnerable road users from sliding underneath the rear wheels of the truck or (semi)trailer. Not much is known about the effect of side shields on road safety, but according to estimates a positive effect is expected [44].

The presence and use of seat belts is mandatory for occupants of trucks and delivery vans

EU directive 2003/20/EC [45]

Not much is known about the road safety effect of seat belt use among drivers of trucks and delivery vans. These drivers use seat belts less often than car drivers [46]  [13]. It is to be expected that increasing seat belt use among occupants of trucks and delivery vans will lead to fewer severe injuries. 

Introduction blind spot mirror

1 January 2003 [47]

The decrease of the number of road deaths due to blind spot crashes in the first few years after the introduction of the blind spot mirror may be caused by this introduction and the associated publicity, but also by coincidental fluctuations [32]. Not much is known about the road safety effect of the front-view mirror, the more convex wide-angle mirror and the larger close-proximity mirror.

Introduction of front-view mirror, more convex wide-angle mirror and larger close-proximity mirror 

EU-richtlijn 2007/38/EC [48]

Mandatory 90km/h speed limiters for N2 and N3 vehicles

2005: Article 5.3.15 in [3]

Lower speeds decrease both crash rates and crash outcome severity (see SWOV fact sheet Speed and speed management.

Retroreflective contour marking of trucks with a maximum mass exceeding 7.5 tonnes and trailers exceeding 3.5 tonnes

2008: EU directive 2007/35/EG [49]

2011: retrofit trucks that are issued with a registration number for the first time (in accordance with [49])

Research into the effectiveness of applying  retroreflective contour marking to existing trucks (retrofitting) shows that, in the Netherlands, this measure will save an annual maximum of three road deaths [50].

Automatic Emergency Braking (AEB) system mandatory for trucks

2013: EU regulation 661/2009 [51]

Although a positive road safety effective of AEB has been proved for cars [52], there are no exact figures of the road safety effect of AEB for trucks. Several studies theoretically estimate a positive effect of AEB for trucks [53], although practical tests at a test track show that current AEB implementations for trucks are not always reliable in the timely detection of obstacles [54].

Lane Departure Warning (LDW) system mandatory for trucks

2013: EU regulation 661/2009 [51]

Research shows that trucks with an LDW system have a 1.9 smaller risk of getting involved in sideswipe collisions, single vehicle crashes and head-on collisions due to lane departure [55].

Table 5. Vehicle measures taken to increase road safety for trucks and delivery vans.

Possible new vehicle measures

Blind spot detection and warning systems (BSW) may alert truck drivers to other road users in their blind spot [55]. Collision avoidance systems (such as Advanced Cruise Control) may also help prevent crashes, but may distract drivers as well [57], also see SWOV fact sheet Intelligent transport and driver assistance systems (ITS and ADAS).

In Great Britain, a method has been developed to assess direct vison (without using mirrors) of vulnerable road users from the cabin [58]. to reduce the number of blind spot crashes. A truck may score zero to five stars, the latter corresponding to the best possible direct vision of vulnerable road users. The mayor of London has applied this standard by only allowing N3 trucks, from 26 October 2020 onwards, access to London when scoring a minimum of one star. From 2024 onwards, trucks should have at least three starts to be allowed to enter London [59]. This measure forces manufacturers to build trucks with improved direct vision, for example by fitting the motor block differently which lowers the truck driver’s seat and the position of the side windscreens.

What other measures were taken and how effective were they?

In addition to driver training and vehicle measures, measures were taken in the field of:

  • Behavioural rules for truck drivers and enforcement;
  • network and logistics;
  • information and education campaigns for other road users.

Behavioural rules for truck drivers and enforcement

In addition to the general behavioural rules for motorised traffic, two extra rules apply to truck drivers. On some roads, trucks are not allowed to overtake, and professional drivers should comply with legal driving time and rest period regulations. Monitoring compliance is hindered by tachograph fraud. For enforcement of the general ban on handheld phoning, police experiment by monitoring from touring coaches, among other things.  

For a number of motorways, an overtaking ban has applied to trucks since 2003. The ban was imposed to help prevent bottlenecks in traffic flow and road safety [60]. A disadvantage of the ban is that a long line of trucks may occur that will complicate merging and exiting for other traffic. In addition, driving in a long line for some time may cause truck drivers to lose concentration. In 2014, it was therefore decided to abolish the overtaking ban on road sections of the main road network with more than three lanes per driving direction and on quiet roads with 2x2 lanes. On busy roads with only two lanes, however, the overtaking ban has been extended to include overtaking at other times than during rush hour. On road sections longer than 30 kilometres, the overtaking ban for trucks is suspended for five kilometres to allow trucks to overtake, which prevents long lines of trucks [61].

Fatigue is a significant factor in causing truck crashes. For that reason, legislation concerning and enforcement of the driving time and rest periods is important. There are doubts however, about the effectiveness of this legislation. In 2012, the Dutch Safety Board concluded that employers fail to take legal responsibility in scheduling the workload of truck drivers in such a way that they are able to comply with driving time and rest period legislation [22].For decades, random checks of tachographs have shown 25% of the truck drivers to drive longer hours than legally permitted. The Dutch Safety Council adds that the checks only look at the last time of rest, which does identify occasional offences but not a structural rest deficiency. Thus, there is insufficient attention for the driver’s biorhythm and for working in irregular shifts. The board also notes that a shortage of adequate rest areas along motorways contributes to driving too long uninterrupted hours. In 2017, random checks not only showed regular manipulation of tachograph data (5-30% of the trucks checked), but also that tachograph fraud is becoming harder and harder to detect. The Human Environment and Transport Inspectorate (ILT) therefore concludes that adequate enforcement of driving time and rest periods can no longer be guaranteed [62].

Enforcement of distraction prevention by e.g. checking ‘phone use while driving a truck’ is hard because of the height of the cabins. Recently, police have overcome this difficulty by making use of touring coaches during wide-scale checks [63] [64].

The higher touring coach seats offer police the opportunity to look directly into the truck cabins. When handheld phone use is observed, a police support car is alerted in order to stop the truck driver. The effectiveness of this new enforcement method has not been studied yet.

Network and logistics

The ‘freight transport quality network’ and ‘urban distribution’ are two examples of the way in which safety of freight traffic in and around urban areas may be improved. The freight transport quality network aims to process the flow of goods in an efficient and responsible way. Urban distribution relates to the way in which inner-city shops and catering facilities are supplied. According to the vision ‘Sustainable Safety’ completely separating freight traffic from other traffic is preferable. After all, trucks are much heavier than other traffic, which implies crashes often have a more serious outcome.

The freight transport quality network is an interconnecting network for economic centres in the Netherlands which processes important freight flows. These networks have been developed to structure freight flow in such a way that accessibility, viability and safety are optimally combined [65]. In every region, roads that are accessible to trucks are specified [33]. In 1997, the cities of Amsterdam, Rotterdam, Den Haag and Utrecht developed a freight transport quality network for their urban conglomeration (Randstad). The Southern, Northern and Eastern Netherlands also have networks [66] . Whether the introduction of quality networks has led to a decrease of the number of road casualties has not been studied.

Urban distribution refers to the process of supplying shops and catering facilities in inner cities. Measures to optimise urban distribution are e.g. widening delivery windows, more efficient supply processes (by combining deliveries for several shops for example), transhipment from heavy to lighter trucks and delivery vans (so that heavier trucks need not enter the city, early morning and late evening distribution using quiet vehicles (before the morning and after the evening rush hour) and introducing logistic routes. Particularly the measures to separate heavy trucks and vulnerable road users fit within the SWOV vision of sustainably safe mobility. Calculation examples show that measures for urban distribution could also improve road safety [33] [67]. More intricate data to exactly calculate the effect of urban distribution are missing from the available databases.

Ideally, heavy goods vehicles are separated from lighter vehicles [68]. This is attainable by means of a logistic system which separates heavy goods vehicles on the main road network and lighter vehicles on the underlying road network, and by avoiding times and places with a lot of vulnerable road users. This will take measures that go further than urban distribution and the freight transport quality network.

Information for and education of other road users

In the Netherlands, several parties have developed teaching methods to make older primary school children (groups 7 and 8) and younger secondary school children (groups 1 and 2) aware of the dangers of trucks in traffic (e.g. www.veilig-op-weg.nl or [69]). These teaching methods usually consist of an instructional video and of experiencing the blind spot from the truck driver’s perspective. Evaluation of two Dutch educational programmes about the blind spot, targeting young people, showed that knowledge about the blind spot had increased but had not automatically led to safer road user behaviour [70] . It is unknown whether this kind of teaching method has contributed to a decrease of the number of annual blind spot crashes (also see SWOV fact sheet Traffic education).

Publications and sources

Below you will find the list of references that are used in this fact sheet. All sources used can be consulted or retrieved via our Library portal. Here you can also find more literature on this subject.

[1]. European Parlement (2007). Directive 2007/46/EC of the European Parliament and of the Council of 5 September 2007 establishing a framework for the approval of motor vehicles and their trailers, and of systems, components and separate technical units intended for such vehicles (Framework Directive)..

[2]. Ministerie van IenW (2018). Reglement verkeersregels en verkeerstekens 1990. Ministerie van Infrastructuur en Waterstaat. Accessed on 29-08-2018 at wetten.overheid.nl/BWBR0004825/2018-07-01.

[3]. Ministerie van IenW (2018). Regeling voertuigen. Ministerie van Infrastructuur en Waterstaat. Accessed on 29-08-2018 at wetten.overheid.nl/BWBR0025798/2018-05-20.

[4]. Directie Dienst Wegverkeer (2018). Beleidsregel keuring en ontheffingsverlening LZV. Accessed on 12-12-2018 at wetten.overheid.nl/BWBR0032533/2018-05-01.

[5]. Salet, M., Aarts, L., Honer, M., Davydenko, I., et al. (2010). Langere en zwaardere vrachtauto's in Nederland. Rijkswaterstaat - Dienst Verkeer en Scheepvaart, Delft.

[6]. Ministerie van IenM (2013). Verkeersborden en verkeersregels in Nederland. Ministerie van Infrastructuur en Milieu, Den Haag.

[7]. Blook, E. & Kuiken, M. (2009 ). Veilig bestelverkeer. Stand van zaken en ontwikkelingen. dossier C8110. Advies- en Ingenieursbureau DHV, Amersfoort.

[8]. Belastingdienst (2018). Bestelauto of personenauto? Accessed on 29-08-2018 at www.belastingdienst.nl/wps/wcm/connect/bldcontentnl/belastingdienst/zakelijk/auto_en_vervoer/auto_van_de_onderneming/autokosten/bestelauto_of_personenauto.

[9]. CBS (2020). Motorvoertuigenpark; type, leeftijdsklasse, 1 januari. CBS. Accessed on 18-12-2020 at opendata.cbs.nl/statline/#/CBS/nl/dataset/82044ned/table?dl=47E95.

[10]. CBS (2020). Verkeersprestaties motorvoertuigen; kilometers, voertuigsoort, grondgebied. Accessed on 30-11-2020 at opendata.cbs.nl/statline/#/CBS/nl/dataset/80302ned/table?dl=46992.

[11]. Connekt (2017). Gebruikers en inzet van bestelauto's in Nederland. Connekt, Delft.

[12]. AVV (1993). Gebruikershandleiding verkeersongevallenregistratie. Versie 4 1-1-93. Adviesdienst Verkeer en Vervoer AVV, Hoofdafdeling Basisgegevens BG, Rotterdam.

[13]. Temmerman, P., Slootmans, F. & Lequeux, Q. (2016). Ongevallen met vrachtwagens – Fase 1 – Omvang van het probleem, literatuurstudie, analyse van ongevallengegevens en enquête. Belgisch Instituut voor de Verkeersveiligheid – Kenniscentrum Verkeersveiligheid, Brussel.

[14]. IRU (2007). Scientific Study “ETAC” European Truck Accident Causation - Executive Summary and Recommendations. International Road Transport Union funded by European Commission, Directorate General for Energy and Transport, Geneve.

[15]. Davidse, R.J. & Duivenvoorde, K. van (2012). Bestelauto-ongevallen: karakteristieken, ongevalsscenario's en mogelijke interventies. Resultaten van een dieptestudie naar ongevallen met bestelauto's binnen de bebouwde kom [Delivery vehicle crashes: characteristics, crash scenarios and possible interventions; Results of an in-depth study into urban crashes involving delivery vehicles]. R-2012-18 [Summary in English].SWOV, Leidschendam.

[16]. Starren, A.M.L., Beek, F.A. van der, Gort, J., Steenbergen, A., et al. (2009). Safety Culture bestelverkeer: onderzoek naar de mogelijkheden om te investeren in verkeersveiligheid in het bestelverkeer. TNO, Hoofddorp.

[17]. Bos, J.M.J. & Twisk, D.A.M. (1998). Rijbewijs B: te veel bevoegdheden.[Driving Licence B: too many powers?].. R-98-67 [Summary in English]. SWOV, Leidschendam.

[18]. ETSC (2001). The role of driver fatigue in commercial road transport crashes. European Transport Safety Council, Brussel.

[19]. McKernon, S. (2008). Driver fatigue literature review. Research Report 342. Land Transport New Zealand, Wellington.

[20]. Goldenbeld, C., Davidse, R.J., Mesken, J. & Hoekstra, A.T.G. (2011). Vermoeidheid in het verkeer: Prevalentie en statusonderkenning bij automobilisten en vrachtautochauffeurs; Een vragenlijststudie onder Nederlandse rijbewijsbezitters [Driver fatigue: prevalence and state awareness of drivers of passenger cars and trucks. A questionnaire study among driving licence holders in the Netherlands].. R-2011-4.[Summary in English]. SWOV, Leidschendam.

[21]. Jettinghoff, K., Houtman, I.L.D. & Evers, M.S. (2003). Oorzaken van vermoeidheid bij vrachtwagenchauffeurs in het beroepsgoederenvervoer. TNO-rapport 10276. TNO, Hoofddorp.

[22]. Onderzoeksraad voor Veiligheid (2012). Vrachtwagenongevallen op snelwegen. Onderzoeksraad voor Veiligheid, Den Haag.

[23]. Olson, R.L., Hanowski, R.J., Hickman, J.S. & Bocanegra, J. (2009). Driver distraction in commercial vehicle operations. Report FMCSA-RRR-09-042. US Department of Transportation, Washington, DC.

[24]. Carsten, O., Hibberd, D., Bärgman, J., Kovaceva, J., et al. (2017). Driver distraction and inattention. UDRIVE deliverable 43.1 of the EU FP7 Project UDRIVE.

[25]. Kuiken, M., Overkamp, D. & Fokkema, J. (2006). Ongevallen met vrachtauto’s op rijkswegen; Frequentie, oorzaken, consequenties en oplossingen. Directoraat-Generaal Rijkswaterstaat, Adviesdienst Verkeerd en Vervoer AVV, Rotterdam.

[26]. Frederikse, R., Bruin, M. de, Hermans, E. & Bronner, F. (2002). Sturen op veiligheid: verkenning van mogelijkheden tot stimuleren van verkeersveilig gedrag bij beroepschauffeurs. NIPO Consult / Veldkamp, Amsterdam.

[27]. Hoedemaeker, D.M., Doumen, M.J.A., Goede, M. de, Hogema, J.H., et al. (2010). Modelopzet voor Dodehoek Detectie en Signalerings Systemen (DDSS). TNO Defensie en Veiligheid, Soesterberg.

[28]. European Agency for Safety and Health at Work (2010). A review of accidents and injuries to road transport drivers. Publications Office of the European Union, Luxemburg.

[29]. Clarke, D.D., Ward, P., Bartle, C. & Truman, W. (2005). An in-depth study of workrelated road traffic accidents. Road Safety Research Report, No. 58. Department for Transport (DfT), London.

[30]. Kühn, M., Bende, J., Sferco, R., Schäfer, R., et al. (2011). Safety of light goods vehicles. Findings from the German joint project of BASt, DEKRA, UDV and VDA. Contribution to the 22nd International Technical Conference on the Enhanced Safety of Vehicles, June 13-16, 2011, Washington, DC.

[31]. Davidse, R.J. & Duijvenvoorde, K. van (2012). Bestelauto-ongevallen: karakteristieken, ongevalsscenario's en mogelijke interventies. Resultaten van een dieptestudie naar ongevallen met bestelauto's binnen de bebouwde kom [Delivery vehicle crashes: characteristics, crash scenarios and possible interventions; Results of an in-depth study into urban crashes involving delivery vehicles]. R-2012-18 [Summary in English]. SWOV.

[32]. Schoon, C.C., Doumen, M.J.A. & Bruin, D. de (2008). De toedracht van dodehoekongevallen en maatregelen voor de korte en lange termijn. [The circumstances of blind spot crashes and short- and long-term measures].. R-2008-11A [Summary in English]. SWOV, Leidschendam.

[33]. Mesken, J., Schoon, C.C. & Duijvenvoorde, K. van (2012). Veiligheid van vracht- en bestelverkeer: de stand van zaken. [Safety of freight and delivery traffic: state of the art]. R-2012-17 [Summary in English]. SWOV, Den Haag.

[34]. Eurostat (2019). Individuals using the internet for ordering goods or services. Accessed on 13-02-2019 at ec.europa.eu/eurostat/tgm/table.do?tab=table&tableSelection=1&labeling=labels&footnotes=yes&layout=time,geo,cat&language=en&pcode=tin00096&plugin=0.

[35]. CBR (2019). Vrachtautorijbewijs halen. Accessed on 26-02-2019 at www.cbr.nl/nl/rijbewijs-halen/vrachtauto/vrachtautorijbewijs-halen.htm.

[36]. CBR (2020). Code 95 behouden. Nascholing. Accessed on 23-03-2020 at www.cbr.nl/nl/beroepsexamens/code-95/code-95-behouden/nascholing.htm.

[37]. European Commission (2006). Regulation (EC) No 561/2006 of the European Parliament and of the Council of 15 March 2006 on the harmonisation of certain social legislation relating to road transport and amending Council Regulations (EEC) No 3821/85 and (EC) No 2135/98 and repealing Council Regulation (EEC) No 3820/85 (Text with EEA relevance). European Commission.

[38]. European Commission (2018). Driving time and rest periods. Accessed on 29-08-2018 at ec.europa.eu/transport/modes/road/social_provisions/driving_time/.

[39]. Overheid.nl (1998). Arbeidstijdenbesluit vervoer. Accessed on 24-03-2020 at wetten.overheid.nl/BWBR0009386/2020-01-25.

[40]. Vlakveld, W.P., Goldenbeld, C., Knapper, A. & Bax, C. (2014). Veiligheidscultuur in het wegtransport. R-2014-12. SWOV, Den Haag.

[41]. Schein, E.H. (2004). Organizational culture and leadership.  3rd ed. Wiley, San Francisco, CA.

[42]. Hudson, P.T.W., Parker, D. & Graaf, G.C. van der (2002). The Hearts and Minds Program: Understanding HSE culture. In: Proceedings of the 6th SPE  International Conference on Health Safety and Environment in Oil and Gas Exploration and Production. Society of Petroleum Engineers, Richardson TX.

[43]. Bax, C., Goldenbeld, C. & Korving, H. (2014). Veiligheidscultuur in de praktijk: motieven, uitvoering en effecten. R-2014-33 SWOV, Den Haag.

[44]. Langeveld, P.M.M. & Schoon, C.C. (2004). Kosten-batenanalyse van maatregelen voor vrachtauto’s en bedrijven. Maatregelen ter reductie van het aantal verkeersslachtoffers en schadegevallen[Cost-benefit analysis of measures for lorries and haulage companies. Measures for reducing the number of casualties and material damage].. R-2004-11 [Summary in English]. SWOV, Leidschendam.

[45]. European Parlement (2003). Directive 2003/20/EC of the European Parliament and of the Council of 8 April 2003 amending Council Directive 91/671/EEC on the approximation of the laws of the Member States relating to compulsory use of safety belts in vehicles of less than 3,5 tonnes.. EUR-Lex.

[46]. Lequeux, Q. (2016). Hoe staat het met onze gordeldracht? Resultaten van de gedragsmeting gordel 2015. Belgisch Instituut voor de Verkeersveiligheid – Kenniscentrum Verkeersveiligheid, Brussel.

[47]. Ministerie van VenW (2002). Besluit van 9 oktober 2002, houdende wijziging van het Voertuigreglement in verband met het verplicht stellen van bepaalde gezichtsveldverbeterende voorzieningen voor bedrijfsauto's. Staatsblad 2002, 547. Ministerie van Verkeer en Waterstaat     

[48]. European Parlement (2007). Directive 2007/38/EC of the European Parliament and of the Council of 11 July 2007 on the retrofitting of mirrors to heavy goods vehicles registered in the Community. EUR-Lex.

[49]. European Commision (2007). Commission Directive 2007/35/EC of 18 June 2007 amending, for the purposes of its adaptation to technical progress, Council Directive 76/756/EEC concerning the installation of lighting and light-signalling devices on motor vehicles and their trailers (Text with EEA relevance).. EUR-Lex.

[50]. Wijnen, W., Bax, C.A., Stipdonk, H.L., Wegman, R.W.N., et al. (2015). Invoering van contourmarkering voor het bestaande vrachtwagenpark [Retrofit introduction of contour marking for lorries]. R-2015-2 [Summary in English]. SWOV, Den Haag.

[51]. European Parlement (2009). ). Regulation (EC) No 661/2009 of the European Parliament and of the Council of 13 July 2009 concerning type-approval requirements for the general safety of motor vehicles, their trailers and systems, components and separate technical units intended therefor (Text with EEA relevance). EUR-Lex.

[52]. Saadé, J. (2017). Autonomous Emergency Braking AEB (pedestrians & cyclists). European Road Safety Decision Support System, developed by the H2020 project SafetyCube. Accessed on 12-03-2020 at www.roadsafety-dss.eu.

[53]. Mettel, C. (2018). Autonomous Emergency Brake (AEB) in HGVs. European Road Safety Decision Support System, developed by the H2020 project SafetyCube. Accessed on 12-03-2020 at www.roadsafety-dss.eu.

[54]. Hattem, J. van, Klem, E. & Gorter, M. (2017). AEBS en verkeersmaatregelen – Praktijktest zichtbaarheid verkeersmaatregelen voor Autonomous Emergency Braking Systems. rapport T&PBF1326R001F02. Royal HaskoningDHV, Amersfoort.

[55]. Hickman, J.S., Guo, F., Camden, M.C., Hanowski, R.J., et al. (2015). Efficacy of roll stability control and lane departure warning systems using carrier-collected data. In: Journal of Safety Research, vol. 52, p. 59-63.

[56]. Connekt (2010). Dodehoek Detectie- en Signalerings Systemen (DDSS): Onderzoek naar de werking en de mogelijkheden. Connekt, Delft.

[57]. Eenink, R.G. (2009). Verkeersveiligheidseffecten van Anti-Ongevalsystemen. Schatting van de effecten op ongevallen met vrachtauto's op autosnelwegen.[Road safety effects of Anti-Crash Systems. Estimation of the effects on crashes on motorways involving lorries]. R-2009-11 [Summary in English]. SWOV, Leidschendam.

[58]. Summerskill, S., Marshall, R., Patterson, A., Eland, A., et al. (2017). The definition, production and validation of the direct vision standard (DVS) for HGVs. Loughborough Design School, Loughborough University, UK.

[59]. Transport for London (2018). Direct Vision Standard for HGVs. Accessed on 26-09-2018 at https://tfl.gov.uk/info-for/deliveries-in-london/delivering-safely/direct-vision-in-heavy-goods-vehicles.

[60]. Rijkswaterstaat (2019). Inhaalverbod voor vrachtverkeer. Rijkswaterstaat, Ministerie van Infrastructuur en Waterstaat. Accessed on 07-08-2019 at www.rijkswaterstaat.nl/wegen/wetten-regels-en-vergunningen/verkeerswetten/inhaalverbod-vrachtverkeer/.

[61]. Rijkswaterstaat (2014). Rijkswaterstaat past inhaalverbod vrachtwagens aan. Rijkswaterstaat. Accessed on 26-02-2019 at rijkswaterstaatverkeersinformatie.nl/Nieuws/article/VID.2014.114.06.

[62]. ILT (2018). Fraude met tachografen staat handhaving rij- en rusttijden in de weg. Signaalrapportage ILT. Inspectie Leefomgeving en Transport ILT, Ministerie van Infrastructuur en Waterstaat.

[63]. Politie (2018). Tweede controle met touringcar wijst uit: nog steeds veel afleiding in het verkeer door mobiele telefoon. Accessed on 14-02-2019 at www.politie.nl/nieuws/2018/juni/22/02-verkeerscontrole-touringcar.html.

[64]. NOS (2018). Politie let vanuit bus op mobiel achter stuur: 'Schrikken van de aantallen'. NOS. Accessed on 14 februari 2019 at https://nos.nl/artikel/2255182-politie-let-vanuit-bus-op-mobiel-achter-stuur-schrikken-van-de-aantallen.html.

[65]. Ministerie van VenW (2006). Kwaliteitsnet Goederenvervoer. Ministerie van Verkeer en Waterstaat, Den Haag.

[66]. Bax, C.A., Goldenbeld, C., Knapper, A., Vaartjes, I., et al. (2016). Vracht- en bestelverkeer: veld van actoren en veiligheidsissues. R-2014-27A. SWOV, Den Haag.

[67]. Mesken, J. & Schoon, C.C. (2011). Stedelijke distributie: conceptuele aanpak verbetering verkeersveiligheid. H-2011-2 SWOV, Leidschendam.

[68]. SWOV (2018). Sustainable Safety 3rd edition – The advanced vision for 2018-2030. Principles for design and organization of a casualty-free road traffic system.. SWOV, Den Haag.

[69]. Verkeerswijzer Groningen (2019). Dode hoek voorlichting bij vrachtwagens. Accessed on 30-01-2019 at www.verkeerswijzergroningen.nl/product/dodehoek-voorlichting-bij-vrachtwagens.

[70]. Twisk, D., Vlakveld, W., Mesken, J., Shope, J.T., et al. (2013). Inexperience and risky decisions of young adolescents, as pedestrians and cyclists, in interactions with lorries, and the effects of competency versus awareness education. In: Accident Analysis & Prevention, vol. 55, p. 219-225.

-

6 + 5 =
Solve this simple math problem and enter the result. E.g. for 1+3, enter 4.

Would you like to cite this fact sheet?

SWOV publication

This is a publication by SWOV, or that SWOV has contributed to.