Cyclists

Updated

In the Netherlands, over a third of road deaths and well over two thirds of serious road injuries are cyclists. Cyclist fatality risk (the number of road deaths per distance travelled) is more than eight times higher than fatality risk for drivers, but over three times as low as that for motorised two-wheelers. Almost three quarters of the cyclist fatalities and over half the seriously injured cyclists are aged 60 or over.

Bicycle crashes mostly result from a combination of vehicle, road, and behaviour factors. Bicycles are balance vehicles, which implies that cyclists may quickly lose their balance, for example when mounting or dismounting, or when the road surface is uneven. Road obstacles or too narrow or slippery bicycle tracks are infrastructure features that may result in crashes. Cyclist behaviour, such as cycling under the influence, red light running, texting while cycling, and cycling without appropriate bicycle lights, may contribute to the occurrence of a crash. Yet, the behaviour of other road users may also give rise to crashes.

A cyclist is unprotected in a crash or fall, in contrast with car occupants (roll cage and air bags). That is why cyclists are vulnerable road users. Cyclists may, however, protect themselves by wearing a helmet. Bicycle helmets may substantially prevent serious brain trauma in case of a crash. Measures to improve cyclist safety are: separating cyclists from heavier and faster motorised traffic, both in time and space; stabilising bicycles by adding an extra wheel or automatic steering correction; and fitting cars and trucks with advanced safety systems.

In this fact sheet, unless otherwise specified, crash data do not distinguish between different bicycle types, among which, for example, cargo bikes, recumbents, city bikes, or pedelecs. This, because type distinction in crash statistics is not reliable. Speed pedelecs, on the other hand, do form a separate category. See SWOV fact sheet Pedelecs and speed pedelecs.

How many road casualties are cyclists?

In 2021, 207 road deaths were cyclists. These figures concern all fatalities registered as cyclists, so including cyclists on pedelecs, cargo bikes, racing bikes, etcetera. The number of road deaths among those using pedelecs is increasing; from at least 28% in 2017 to at least 39% in 2021. Since pedelec use is not always registered in case of a crash, this is a lower limit [1].

In the Netherlands, 68% of the serious road injuries in 2020, registered in the hospital registration, were cyclists (see SWOV fact sheet Serious road injuries in the Netherlands). Most of the injured cyclists (83%) sustained serious injuries in a crash not involving a motor vehicle; they are cyclists falling, or colliding with an obstacle (e.g., a bollard) or another cyclist or pedestrian (see the question Where, when, and how do most cycling casualties occur?). Slightly more than half (53%) of the seriously injured cycling casualties were aged 60 or over [2] (see the question Which cyclist groups have most casualties?).

Is cycling safer or less safe than other modes of transport?

Cycling is less safe than driving, but safer than riding a (light) moped or motor cycle (see the question What are the main causes of bicycle crashes?). Expressed in number of road deaths per kilometre travelled, fatality risk for cyclists is well over eight times as high as fatality risk for car occupants, but well over three times less high as that for (light) moped rider and motor cyclists. In the last decade (2012-2021), fatality risk for cyclists hardly decreased, as shown by Figure 1.

Afbeelding

Figure 1. Fatality risk (number of road deaths per kilometre travelled) in the Netherlands, averaged over three-year periods. Sources: Statistics Netherlands (Road death Statistics; Travel in the Netherlands (Dutch abbreviation OviN); On the road in the Netherlands (Dutch abbreviation (ODiN), department of Public Works and Water Management (Mobility Survey Netherlands (Dutch abbreviation MON)), edited by SWOV.

Where, when and how do most bicycle casualties occur?

Most cycling fatalities occur after a crash not involving a motor vehicle. Most seriously injured cyclists sustain injuries in crashes not involving a motor vehicle. Actual facts about bicycle crashes are scarce, because bicycle crashes in the Netherlands are very poorly registered, particularly when they concern non-fatal crashes not involving a motor vehicle [3].

Cycling fatalities

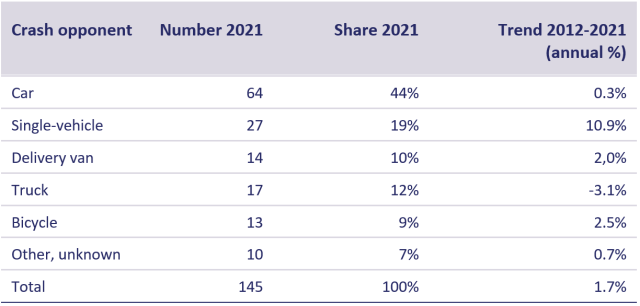
The crash registration shows that, in 2021, most (44%) cycling fatalities occurred after a crash with a car. In addition, relatively many (19%) cycling fatalities occurred in single-bicycle crashes. These are crashes not involving any other road users; they often concern falls after mounting or dismounting or crashes with objects (kerbs, bollards) etcetera. Since not every bicycle crash type is registered equally well, the number of cycling fatalities not involving motor vehicles is an underestimation.

In ten years (2012-2021), the share of road deaths on account of single-bicycle crashes significantly increased by an annual 10% (Table 1). This long-term development shows that the number of road deaths in single-bicycle crashes increased more strongly than the total number of bicycle crashes.

Tabel

Table 1. The number of road deaths among cyclists by crash opponent, as registered in BRON, and long-term developments. Note: crashes not involving motor vehicles are underestimated in this table. Source: Ministry of Infrastructure and Water Management.

Almost three in five registered cycling fatalities (58%) occur in urban areas. Both in urban areas (60%) and in rural areas (55%), more than half occur at an intersection (data 2012-2021; source: Ministry of Infrastructure and Water Management).

Cycling fatalities are almost evenly spread across the days of the week, with slightly lower weekend shares (Figure 2). About half of the fatal bicycle crashes occur in the afternoon (49%) and one third (33%) in the morning (Figure 3).

Afbeelding

Figure 2. Share of registered cycling fatalities (BRON) by day of the week (2012-2021). Source: Ministry of Infrastructure and Water Management.

Afbeelding

Figure 3. Share of registered cycling fatalities (BRON) by part of the day ( 2012-2021). Source: Ministry of Infrastructure and Water Management.

Bicycle injuries

On the basis of the available data on serious bicycle injury crashes, a reliable breakdown by location, day of the week and time of day cannot be provided. We do know that by far most cyclists sustain serious injuries in crashes not involving a motor vehicle. In 2020, their number amounted to over 80% [2]. The injuries were mostly sustained in single-bicycle crashes, so without involvement of other road users. In a questionnaire survey among A&E-treated cyclists in the period from July 2020 to June 2021 [4] over a quarter (27%) reported that the crash had occurred in the afternoon (13.30-15.59 hours) on both week and weekend days. Yet, compared to other age groups, cyclists aged 18 to 24 relatively often reported that the crash had occurred in the evening (19.00 to 23.59 hours) or at night (00.00-05.59 hours). More than half (56%) of the A&E-treated cyclists reported that the crash had occurred in the urban area.

Abroad, cyclists also mainly sustain injuries in (single-bicycle) crashes not involving motor vehicles. An international meta-analysis [5] of single-bicycle crashes up to 2013 shows that 60%-95% of the bicycle injuries are sustained in a single-bicycle crash. A review of studies up to 2019, in mostly European countries, shows that the share of bicycle injuries caused by a single-bicycle crash varies between 52% and 85% [6].

What are the main causes of bicycle crashes?

Most of the time, it is a combination of factors that results in a bicycle crash. These factors concern infrastructure, vehicle (the bicycle) and human behaviour, and are discussed below. For potential measures in each of these fields, see the question Which measures may improve cyclist safety.

Infrastructure as a (contributory) cause

Both road design and road quality play a role in the occurrence of bicycle crashes not involving a motor vehicle, and in single-bicycle crashes.

Poor quality or unevenness (potholes or cracks) of the road surface often contribute to the occurrence of single-bicycle crashes. Typical causes are (amongst others [4] [7] [8] [9]):

  •     (invisible) obstacles;
  •      no markings along the road;
  •      too narrow bicycle tracks and/or roads;
  •      slippery roads due to rain, ice or snow, or wet leaves.

Crashes between cyclists and motor vehicles occur at locations where they cross paths. The absence of a (physically separate) cycling infrastructure increases the risk of a bicycle-motor vehicle crash. A Danish questionnaire survey shows that bicycle crashes at intersections involving more crash opponents result in serious injuries [10]. A recent Dutch study shows that – checked for kilometres travelled by cyclist and motor vehicle – 50-60% fewer crashes occur on separate bicycle tracks than in bicycle lanes [11]. Specific design features of the cycling infrastructure affect cyclist safety. Thus, at unsignalised intersections, cyclists on two-way bicycle tracks run a higher risk of crashing with a motor vehicle than on one-way bicycle tracks [12] [13]. For more information about a safe cycling infrastructure, see SWOV fact sheet Infrastructure for pedestrians and cyclists.

Vehicle as (contributory) cause

Whether the vehicle features of bicycles play a role in crash occurrence is hard to determine, and even if this role is determined, it is not systematically registered. Yet, bicycles (with two wheels) are balancing vehicles, which increases the risk of a fall [8] [14], particularly at low speeds [15].

A disturbed balance may, in different ways, contribute to the occurrence of single-bicycle crashes (as discussed in [16]):

  • When being (dis)mounted, bicycles have a low speed and cyclists need physical exertion to keep their balance; if they fail to do so, a fall is (almost) unavoidable (amongst others [17]).
  • Slipping or blocking – because something gets between the spokes of (especially) the front wheel) – may disturb the cyclist’s balance which also makes a fall (almost) unavoidable (amongst others [4]).
  • Sometimes, small road surface imperfections, height differences between the road surface and the verge, or a gust of wind may disturb a cyclist’s balance, resulting in a fall or in swaying  (amongst others [18]).

Bicycle defects, problems with wheels, gears or broken chains may also cause a (single-) bicycle crash (amongst others [7] [19] [20]). In a questionnaire survey among the cyclists treated at an A&E department between July 2020 and June 2021-, 5% reported (n=3,605) that a defect had caused their (mostly single-) bicycle crash.

Behaviour as a (contributory) cause

Unsafe behaviour by other road users (e.g., speeding, distraction, red light running or drink driving) increases the risk of a bicycle crash. Bicycle crashes may also be caused by consciously or unconsciously unsafe behaviour of cyclists themselves, such as cycling under the influence (see the question How often does cycling under the influence occur and how does this affect road safety?), red light running (see the question How often does red light running occur among cyclists and how does this affect road safety?), smartphone use (see the question How often do cyclists use their smartphones and how does this affect road safety?) and cycling without lights (see the question How often does cycling without lights occur and how does this affect road safety?). A recent Danish questionnaire survey shows that a cyclist’s own behaviour preceding crashes not involving motor vehicles plays a smaller role in the occurrence of bicycle crashes than, for example, infrastructural factors, such as slipperiness and obstacles [20].

Which cyclist groups have most casualties?

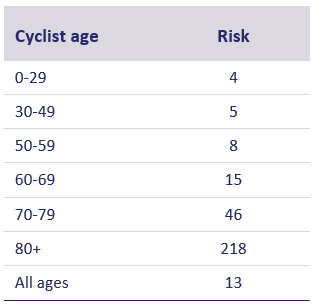
Most cycling casualties occur among older cyclists. Almost three quarters of the cycling fatalities and over half of the seriously injured cyclists occur among cyclists aged 60 or over [2]. Per kilometre travelled, older road users also run a higher risk of being killed or seriously injured in a bicycle crash, as is shown in Table 2. For cyclists aged 80 or over, fatality risk per distance travelled is 17 times higher than average (for all ages). Fatality risk for cyclists aged 70-79 is four times higher. This increased risk can largely be explained by the greater risk of serious crash injuries, and seems to a lesser extent to be due to more frequent crash involvement (see SWOV fact sheet Older road users).

In the last decade, the share of the over-60s among seriously injured cyclists increased from 42% in 2010 to 53% in 2020. The increasing ageing of the population in combination with increased cycling mobility – partly due to the popularity of pedelecs - may at least partially explain the rise in serious injuries [16] [21].

Tabel

Table 2. Fatality risk by cyclist age group, based on the real number of road deaths per billion kilometres travelled (2012-2021). Source: Statistics Netherlands, edited by SWOV.

Most cyclist fatalities are men. In 2017-2021, they made up over two thirds (68%) of the actual number of cyclist fatalities.

Are pedelecs less safe than regular bicycles?

There are no reliable data on crashes and kilometres travelled to determine the risk of pedelecs compared to that of ‘regular’ bicycles. Yet, in the Netherlands and elsewhere, some targeted (questionnaire) studies were carried out, but no unambiguous conclusions may be drawn. Also, when looking at possible differences in injury severity between cyclists on pedelecs and those on regular bicycles, unequivocal conclusions cannot be drawn. For further explanation, see SWOV fact sheet Pedelecs and speed pedelecs.

What are the risks of bicycle racing on public roads?

Het is niet bekend of wielrennen op de openbare weg gevaarlijker is dan gewoon fietsen. Slachtoffers onder wielrenners worden namelijk niet als aparte categorie geregistreerd in de ongevallenregistratie BRON. Since racing cyclists are not registered as a separate category in crash registration BRON, it is unknown whether bicycle racing on public roads is more dangerous than ordinary cycling. Nor is information available on the annual distance travelled by this group. The Dutch Injury Surveillance System, based on hospital data, does contain information on crashes during bicycle racing. In 2020, over 10% of the cyclist casualties treated at an A&E department reported to have been bicycle racing at the time of the crash, and this share almost doubled in the last decade (44% [4]).

The same questionnaire survey among A&E-treated cyclist casualties [4] shows that over 40% of the racing cyclists had fallen without crash involvement; they had slipped for instance, or had fallen after a forced evasive manoeuvre. An equal percentage of racing cyclists had crashed with another road user, of whom 15% with another racing cyclist. Over 10% had crashed with an object, for example a bollard (2%) or another obstacle (6%). The racing cyclists participating in the questionnaire said that their own behaviour (36%) or someone else’s behaviour (41%) had played a role in the crash occurrence, with ‘not paying proper attention’ being an important factor.

The Dutch Tour Bike Union (Dutch abbreviation: NTFU) tries to improve the safety of racing cyclists by providing recommendations in the Veiligheidshandboek Wielersport (Cycling Sports Safety Manual) [22].

Are there many blind spot crashes involving cyclists?

Comparatively, cyclists are frequent casualties in blind spot crashes. Blind spot crashes occur when truck or delivery van drivers turn right and do not see a cyclist or pedestrian in front of or to the right of them. In 2008-2016 an annual average of 10 to 11 road deaths occurred due to blind spot crashes with a truck or delivery van, of whom an average of 8 to 9 were cyclists. Since 2017, it has no longer been possible to determine the number of road deaths due to blind spot crashes, as this specific road user manoeuvre is no longer registered.

Potential measures to prevent blind spot crashes with cyclists are: physical separation of cyclists and trucks/delivery vans; developing detection systems; and improving public communication and education of both drivers and cyclists. For more information on blind spot crashes, see SWOV fact sheet Trucks and delivery vans.

Are Dutch bicycle tracks used by too many and too diverse vehicles?

Whether traffic density on bicycle tracks, and the sometimes large differences in speed and mass between bicycle track users, adversely affect road safety cannot be determined on the basis of empirical data.

At specific locations and times of day, the bicycle tracks in major cities are too narrow to cope with the traffic volumes, but whether this affects cyclist road safety is unknown. In a questionnaire survey among A&E-treated cyclists in the period from July 2020 to June 2021, 80% reported that traffic density had been low at the time of the crash. Yet in crashes in which high traffic density may have been a factor, such as collisions or in forced swerving manoeuvres, 15% to 19% reported that there had been a fair amount of traffic at the time of the crash [4].

Regularly, bicycle tracks are used by many different kinds of vehicles with sometimes large differences in speed, mass, and volume: ordinary bicycles, pedelecs, light mopeds, cargo bikes and, in the rural area, mopeds and speed pedelecs as well. On bicycle tracks, light moped riders travel on average at speeds of 32 km/h, which makes them considerably faster than cyclists (18km/h) or pedelec users (21km/h) [23]. Moreover, (light) mopeds are more than 50 kg heavier and, including mirrors, more than 15 cm wider than bicycles or pedelecs. In general, differences in mass and speed adversely affect safety (see, for example, SWOV fact sheet Sustainable Road Safety), but to what extent this also applies to bicycle tracks is not yet known.

For more information on possible safety effects of high traffic density and vehicle diversity on bicycle tracks, see SWOV fact sheet Infrastructure for pedestrians and cyclists.

What does ‘safety in numbers’ imply?

In road safety, the principle of safety in numbers refers to risks for vulnerable road users. It implies that as the number of cyclists and pedestrians increases their crash risk decreases; or the increase in the number of crashes among these road users is smaller than would be expected considering the increase in their numbers in traffic [24]. This mechanism has been demonstrated in several studies, but the magnitude of the found road safety effect considerably differs. Nor is it clear whether the effect relates to a direct causal relationship [25] [26]. It is, for example, unknown whether the safety-in-numbers effect is caused by drivers behaving differently when the numbers of pedestrians and cyclists increase, or whether the effect is caused by safer facilities in countries with more cyclists and pedestrians, such as bicycle tracks and pavements (amongst others: [27]).

What is the safety effect of car trips being replaced by bicycle trips?

Several studies have modelled how road safety will be affected if car trips are replaced by bicycle trips (amongst others [28] [29] [30] [31]). These studies show that unambiguous conclusions cannot be drawn. Some studies found that such a mobility shift, if large enough, would positively affect the number of crashes between cyclists and motor vehicles [28]. After all, fewer car trips implies fewer possibilities of motor vehicles crashing with vulnerable road users. However, in countries where cycling is common, such as the Netherlands, relatively many single-bicycle crashes occur; crashes without involvement of cars or other vehicles (amongst others [5]). Studies that also take single-bicycle crashes into account arrive at less positive conclusions [29] [31]. Schepers and Heinen [29] for example, found that a shift in car mobility to bicycle mobility indeed hardly affected the number of road deaths, but did adversely affect the number of serious road injuries, caused in particular by an increase in the number of single-bicycle crashes. Stipdonk and Reurings [31] found a negative effect on the number of road deaths, and a larger negative effect on the number of serious injuries.

How often does cycling under the influence occur and how does this affect road safety?

Alcohol intake by cyclists is high, especially in (student) cities. In 2013, measurements were carried out in the cities of Groningen and The Hague on a Thursday and a Saturday between 5 pm and 8 am [32]. These showed that, in that period, an average of 62% of the cyclists had drunk alcohol and that for 42% of them their blood alcohol content (BAC) exceeded the legal limit of 0.5 g/l. After 1 am, these figures were 89% and 68% respectively. The average BAC was 0,79 g/l, but later at night the average BAC increased. As far as we know, no information is available on the prevalence of drug use or medication among cyclists.

Particularly youngsters seem to be involved in a road crash after alcohol intake. In a questionnaire survey among A&E-treated cyclists in the period from July 2020 to June 2021 [4] over 25% of the cyclists aged 18 to 24 reported having drunk alcohol before the crash. Among cyclists aged 12 to 17, this was 7%, and among the over-55s the percentage was between 3% and 5%. The problem of alcohol use among young cyclists appears to have grown in the past two decades: at the end of the last century, 20% to 25% of the young cyclists (aged 15 to 19) hospitalised in weekend nights after a crash without involvement of a motor vehicle had drunk alcohol; in 2010-2014 this percentage had increased to 45%-50% [33]. Additional information on the risk of cycling after alcohol intake is available in SWOV fact sheet Driving under the influence of alcohol.

How often does red light running among cyclists occur and how does this affect road safety?

Red light running often occurs among Dutch cyclists, among youngsters more than among older road users. This is shown in an observational study carried out at five intersections in the city of The Hague, before and after rush hour [34]. One in three (35%) cyclists younger than 20, one in four cyclists aged 21 to 64 (24%), and one in five over-65s (22%) ran a red light.

A German study shows that cyclists running a red light is not an exclusively Dutch phenomenon [35]. Ninety cyclists participated in the study which monitored their behaviour in natural circumstances (naturalistic cycling) over an extended period. In the almost 8,000 red light situations encountered, cyclists ignored the red lights in over 16% of the cases; men (over 17%) slightly more than women (almost 15%). Older cyclists (aged 65 and over) ran a red light less often (in almost 13% of the cases) than other age groups (in almost 18% of the cases).

It is to be expected that red light running by cyclists increases their crash risk, since it will result in more conflicts with other road users. Yet, objective, quantified information on the risk increase on account of red light running is not available. Nor is it known how many cyclists are killed or seriously injured when running a red light. This information is no longer registered.

How often do cyclists use their smartphones and how does this affect road safety?

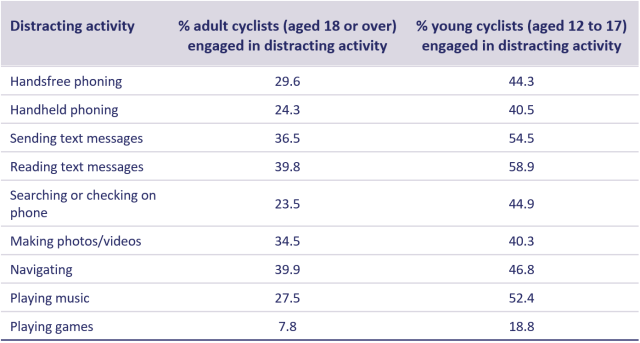
Many cyclists occasionally use their smartphones while cycling; relatively more youngsters than adults. Table 3 shows the self-reported smartphone use by cyclists, broken down by activity and age group [36]. Texting and navigating are the most common smartphone activities, while youngsters also, quite often, play music.

Listening to music is very popular among cyclists, particularly among young cyclists. Over 70% of the cyclists aged 16 to 18 say they sometimes listen to music while cycling [37]. US research among drivers [38] shows that use of telephone screens in particular, for example to text or search for something online, increases crash risk 2.5 times compared to crash risk for drivers not engaged in these activities. Hardly anything is known about a possible risk increase due to smartphone use by cyclists. Additional information on distraction in traffic can be found in SWOV fact sheet Distraction in traffic.

Tabel

Table 3. Percentage of adult cyclists (over-18s) and young cyclists (aged 12 to 17) that report having occasionally engaged in distracting activities while cycling. Source: [36].

How often does cycling without lights occur and how does this affect road safety?

An observational study in December 2021 and January 2022 [39] shows that 86.8% of cyclists had  functioning front lights, and 81.5% functioning rear lights. More than three quarters (78.3) were using both lights. Young and young adult cyclists comparatively less often had lights than older cyclists. Cyclists on regular bicycles used lights clearly less often than on pedelecs or speed pedelecs. Although, in the four major cities (Amsterdam, The Hague, Rotterdam and Utrecht) the use of lights had increased since the previous measurements (from 67% to 73%), it was still significantly lower than in other cities (80%).

Since 2003, these observational studies commissioned by Rijkswaterstaat (Department of Waterways and Public Works) have regularly been repeated in winter months. In December 2021 and in January 2022, over 14,500 cyclists were observed at dusk (3 – 26 lux) and in the dark (< 3 lux). As is shown in Figure 4, bicycle lighting has considerably increased in the last two decades. According to organisations BOVAG and RAI this is due to the fact that more and more bicycles come equipped with automatic lighting [40].

Afbeelding

Figure 4. Percentage of cyclists using front lights, and percentage of cyclists using rear lights (2003-2021/2022). Source: [39].

Regulations

Cyclists are legally obliged to use front and rear lights in the dark and when visibility is poor. The front light must be white or yellow and the rear light red, and the lights must shine straight ahead or straight backward and must not blink [41]. Since 2008, lights that are not attached to the bicycle but to the cyclist’s upper body, for example to a coat sleeve, have also been allowed. The observational study by Timmermans, Prey & Laurens [39] shows that 99% of the cyclists using lights have both front and rear lights attached to their bicycles, which means body lights are not often used.

In addition to front and rear lights, bicycles must be equipped with a red reflector on the rear side, white or yellow reflectors on the wheels or tyres, and (amber) yellow reflectors on the pedals.

Road safety effect

To what extent, properly functioning bicycle lighting enhances cyclist safety is not well-known.

In 2021, the Traffic Psychology Group of the University of Groningen was commissioned by Rijkswaterstaat to conduct a literature review of the visibility effects of new forms of lighting and reflection for bicycles and/or cyclists [42]. The researchers concluded that it cannot be determined that new developments concerning lighting and/or reflection - for example wheel lighting, helmet lighting, spoke reflection, or safety vests – significantly contribute to faster or earlier detection of cyclists, provided they were already using the currently mandatory lighting.

Kuiken and Stoop [43] have calculated that the share of cyclist injury crashes in the dark will decrease by 0.17% when the use of bicycle lighting increases by 1%. This indicates a positive effect of bicycle lighting, but the researchers indicate that the outcome is too uncertain to reliably estimate the extent of the effect. They also say that the estimate is based on registered crashes which, thus, only concerns the effect on bicycle crashes involving motor vehicles. After all, bicycle crashes not involving motor vehicles and single-bicycle crashes are rather poorly registered. On the basis of self-reported behaviour and self-reported crashes as measured in periodic regional road safety research, the researchers have found a slightly increased risk of a single-bicycle crash and a larger increased risk of a multiple crash for cyclists saying they only sometimes or hardly ever use bicycle lighting. It cannot be excluded that cyclists that do not use lights may also differ from cyclists that do use lights in other relevant ways. Therefore, it is uncertain whether the effects mentioned above can be attributed to the bicycle lighting itself.

Are cyclists safer on roundabouts with or without cyclist priority?

Several SWOV reports and a memo by DTV Consultants show that cycling on roundabouts without cyclist priority is safer than on roundabouts with cyclist priority. At the arms of  roundabouts without cyclist priority, cyclists have to give right of way to motorised traffic, while at the arms of roundabouts with cyclist priority, motor vehicles have to give right of way to cyclists. For substantiation, see SWOV fact sheet Roundabouts and other intersections.

Are cyclists exempt from liability in case of crashes?

Dutch law makes a liability exemption for vulnerable road users, among whom pedestrians and cyclists, when they are involved in crashes with motor vehicles. This regards Article 185 of the Road Traffic Act 1994 [44] about strict liability, accessibly summarised in Wikipedia [45]. Among other things, this implies that in crashes between motor vehicles and vulnerable road users, the owner of the motor vehicle is liable by default irrespective of who was at fault. This legal principle was adopted due to the higher risk of serious injuries for vulnerable road users in crashes with much heavier motor vehicles. Only in a proven case of force majeure will this principle be dropped.

Jurisdiction distinguishes between children younger than 14 and vulnerable road users aged 14 or over. Force majeure is never actually granted in the case of children under 14. Drivers are expected to take unpredictable child behaviour into account at all times. In the case of older children and adults, force majeure is only granted in exceptional cases as well. Liability also differs. In the case of children younger than 14, the damage is borne entirely by the liable owner of the motor vehicle. The guiding principle is that children hardly ever cause damage intentionally and are mostly unaware of their hazardous behaviour. In the case of older children and adults, the motor vehicle owner is liable for at least 50% of the damage. The other 50% depends on the extent to which the cyclists or other vulnerable road users themselves are (partly) to blame for the crash.  For more background information and clarification, see the Letter to Parliament sent by the Minister of Security and Justice in November 2020 nden en uitleg over deze wet een Kamerbrief van de minister van Justitie en Veiligheid van november 2020 [46] and the ANWB website [47].

It is sometimes suggested that the law on strict liability could result in more hazardous behaviour by cyclists (or pedestrians). Yet, there is no evidence at all, and considering their physical vulnerability in a crash with a car or other motor vehicles, such an effect seems unlikely.

How effective are bicycle helmets?

Bicycle helmets are very effective in reducing the risk and severity of head and brain trauma in a crash or fall (see SWOV fact sheet Bicycle helmets). In contrast with many other countries, bicycle helmets are not mandatory in the Netherlands, not even for children. They are not mandatory for ordinary cyclists, pedelec riders and racing cyclists, although the latter usually wear helmets voluntarily [48]. For the use of speed pedelecs, however, that have now been categorised as mopeds, helmets are mandatory (see SWOV fact sheet Pedelecs and speed pedelecs).

Which measures may improve cyclist safety?

In contrast with car occupants, cyclists are unprotected in a crash or fall. That is why cyclists are vulnerable road users. There are several measures that may improve cyclist safety. In particular, these regard infrastructure, vehicles (both the bicycle itself and safety systems for motor vehicles) and education.

Safe infrastructure

In general, the infrastructure is sound when cyclists are physically separate from heavier and faster motor vehicles. In space: by separate bicycle tracks; in time: by conflict-free traffic lights (see SWOV fact sheet Sustainable Road Safety). At a more detailed level, it is important that the cycling infrastructure complies with the design guidelines, for example those relating to width, bends and crossing facilities. The quality of the cycling infrastructure is also important – for example bumps and obstacles, such as high kerbs and bollards, should be avoided. For more details on a safe cycling infrastructure, see SWOV fact sheet Infrastructure for pedestrians and cyclists.

Increased bicycle stability

With two wheels, a bicycle is, by definition, a balance vehicle. This makes bicycles less stable, especially when being (dis)mounted, and at low speeds. Several developments are intended to make bicycles more stable. An example is saddles that automatically descend at low speeds which will make it easier for cyclists to have both feet on the ground, e.g., when mounting or dismounting, and will make it less easy to fall over [49].

Another development is smart, active steering support, developed by TU Delft in collaboration with bicycle manufacturer Gazelle [50]. A smart motor in the steering column supports steering as soon as the cyclist threatens to fall over, which could be particularly helpful in preventing a cyclist to fall over at lower speeds.

A completely different method to improve bicycle stability is adding a third wheel. This makes it easier for cyclists with balance problems to dismount when having stopped. For now, rigid tricycles are on the market, which have two rear or front wheels. A disadvantage of the so-called rigid tricycles is that, in certain situation, they may tip, similar to the tipping hazards of three-wheeled mobility scooters [51]. This can be solved by using a second front wheel, both tilting, which allows all three wheels to stay put. The 2022 NVCC road safety prize was won by Piet Noordzij, who had built a prototype of such a tricycle [52]. To what extent such a tricycle will gain a foothold in the market and will allow large-scale production, needs to be investigated further.

Intelligent bicycle

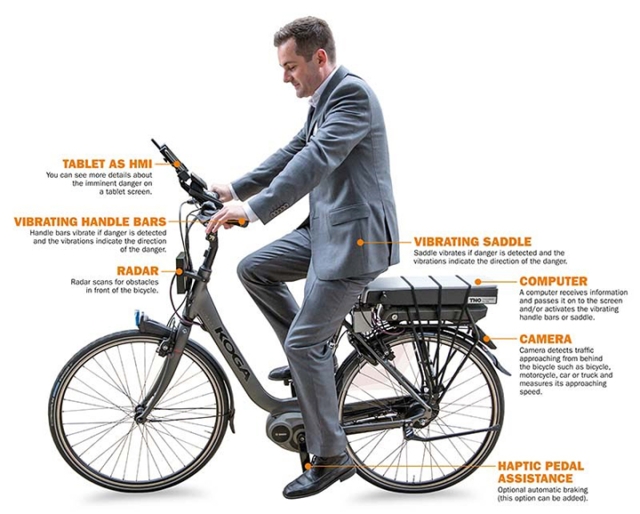
Bicycles may also be provided with intelligent technology, which may alert cyclists to hazardous situations. In the Netherlands, TNO in collaboration with the Fietsersbond (Dutch Cycling Federation) and Roessingh Research & Development, did a lot of development work in this field (see Figure 5; [53]). For now, such intelligent bicycles are not on the market yet, and little news is published on this issue. Moreover, it remains to be seen whether and to what extent the cycling industry will follow through on these developments.

Figure 5. Prototype of the intelligent bicycle, developed by TNO. Source: [54].

Safety systems for trucks

At the end of 2019, European regulation 2019/2144 was published [55]. Among other things, it lays down rules about how vehicle safety systems should protect vulnerable road users, among whom cyclists. From July 2024 onwards, all new vehicles must meet these requirements. The following three issues are central:

  • Advanced systems that can detect pedestrians and cyclists in the vicinity of the front or side of a bus or truck and can issue a warning or can prevent crashes with these vulnerable road users.
  • Bus and truck designs with improved direct visibility of vulnerable road users from the driver seat, while blind spots in front and to both sides of the driver are virtually eliminated.
  • Head impact zone enlargement in cars and delivery vans for vulnerable road users and to ensure their injuries are less serious in case of a crash.

The regulation also lays down rules concerning intelligent speed assistance, distraction warning and reversing detection, which with proper use will benefit the safety of cyclists and other vulnerable road users.

Education programmes

There are several road safety education programmes for cyclists of all ages. They often focus on enhancing knowledge and improving skills. The traffic test for children aged 11/12 (in the 8th grade of primary school) organised by the Dutch Road Safety Association (VVN) focuses on cycling [56]. Targeting older cyclists, the programme CycleOn aims to enable them to cycle safely as long as possible, and to encourage them to take measures to that end themselves.

Not much is known about the effects and impact of these and other cycling education programmes on cyclist behaviour and crashes. Evaluations, if any, are often small-scale and based on self-reported behaviour (see  SWOV fact sheet Traffic education). For Education programmes outside schools, such as the CycleOn initiative, it has sometimes proven hard to find enough participants [57].

Communication campaigns

Bicycle helmet campaigns generally result in an increase of helmet use, but the effect is sometimes temporary [58]. The latest large-scale bicycle helmet campaign also showed an effect on helmet use; over five times as many young children (aged 4-8) wore helmets as before the campaign [59]. The size of the effect proved to be strongly related to the intensity of the annual campaign activities (see SWOV fact sheet Bicycle helmets). In Denmark, (voluntary) bicycle helmet use has been successfully promoted for almost twenty years. Bicycle helmet promotion consists of a combination of public campaigns, communication/education, improved helmet design and helmet availability. The promotion is based on motivations and barriers for helmet use emerging from polls and interviews. In addition, helmet use has been monitored since 2004. This shows helmet use to have increased from 6% to 48% since then, and to be highest among school children (aged 6 to 9) at 94% [60] [61].

Publications and sources

Below you will find the list of references that are used in this fact sheet; all sources can be consulted or retrieved. Via Publications you can find more literature on the subject of road safety.

[1]. Aarts, L.T., Broek, L.J. van den, Oude Mulders, J., Decae, R.J., et al. (2022). Achtergronden bij De Staat van de Verkeersveiligheid 2022. De jaarlijkse monitor [Backgrounds of the State of Road Safety 2022. The annual monitor]. R-2022-10A [Summary in English]. SWOV, Den Haag.

[2]. Aarts, L.T., Wijlhuizen, G.J., Gebhard, S.E., Goldenbeld, C., et al. (2021). Achtergronden bij De Staat van de Verkeersveiligheid 2021. De jaarlijkse monitor [Backgrounds of the State of Road Safety 2021. The annual monitor]. R-2021-21A [Summary in English]. SWOV, Den Haag.

[3]. Bos, N.M., Houwing, S. & Stipdonk, H.L. (2016). Ernstig verkeersgewonden 2015. Schatting van het aantal ernstig verkeersgewonden in 2015 [Serious road injuries 2015. Estimate of the number of serious road injuries in 2015]. R-2016-13 [Summary in English]. SWOV, Den Haag.

[4]. Krul, I., Valkenberg, H., Asscherman, S., Stam, C., et al. (2022). Fietsongevallen en snor-/bromfietsongevallen in Nederland - SEH-bezoeken: inzicht in oorzaken, gevolgen en risicogroepen. Rapport 934. VeiligheidNL.

[5]. Schepers, P., Agerholm, N., Amoros, E., Benington, R., et al. (2015). An international review of the frequency of single-bicycle crashes (SBCs) and their relation to bicycle modal share. In: Injury Prevention, vol. 21, nr. E1, p. e138-e143.

[6]. Utriainen, R., O’Hern, S. & Pöllänen, M. (2022). Review on single-bicycle crashes in the recent scientific literature. In: Transport Reviews, p. 1-19.

[7]. Algurén, B. & Rizzi, M. (2022). In-depth understanding of single bicycle crashes in Sweden - Crash characteristics, injury types and health outcomes differentiated by gender and age-groups. In: Journal of Transport & Health, vol. 24, p. 101320.

[8]. Boele-Vos, M.J., Duijvenvoorde, K. van, Doumen, M.J.A., Duivenvoorden, C.W.A.E., et al. (2017). Crashes involving cyclists aged 50 and over in the Netherlands: An in-depth study. In: Accident Analysis & Prevention, vol. 105, p. 4-10.

[9]. Utriainen, R. (2020). Characteristics of commuters’ single-bicycle crashes. In: Insurance Data. Safety vol. 6, p. 13.

[10]. Hosseinpour, M., Kidholm Osmann Madsen, T., Vingaard Olesen, A. & Lahrmann, H. (2021). An in-depth analysis of self-reported cycling injuries in single and multiparty bicycle crashes in Denmark. In: Journal of Safety Research, vol. 77, p. 114-124.

[11]. Petegem, J.H. van, Schepers, P. & Wijlhuizen, G.J. (2021). The safety of physically separated cycle tracks compared to marked cycle lanes and mixed traffic conditions in Amsterdam. In: European Journal of Transport and Infrastructure Research, vol. 21, nr. 3, p. 19-37.

[12]. Schepers, J.P., Kroeze, P.A., Sweers, W. & Wüst, J.C. (2011). Road factors and bicycle–motor vehicle crashes at unsignalized priority intersections. In: Accident Analysis & Prevention, vol. 43, nr. 3, p. 853-861.

[13]. Prati, G., Marín Puchades, V., Angelis, M. de, Fraboni, F., et al. (2018). Factors contributing to bicycle–motorised vehicle collisions: a systematic literature review. In: Transport Reviews, vol. 38, nr. 2, p. 184-208.

[14]. Kovácsová, N., Winter, J.C.F. de, Schwab, A.L., Christoph, M., et al. (2016). Riding performance on a conventional bicycle and a pedelec in low speed exercises: Objective and subjective evaluation of middle-aged and older persons. In: Transportation Research Part F: Traffic Psychology and Behaviour, vol. 42, p. 28-43.

[15]. Schwab, A.L. & Meijaard, J.P. (2013). A review on bicycle dynamics and rider control. In: Vehicle System Dynamics, vol. 51, nr. 7, p. 1059-1090.

[16]. Schepers, J.P., Weijermars, W.A.M., Boele, M.J., Dijkstra, A., et al. (2020). Oudere fietsers. Ongevallen met oudere fietsers en factoren die daarbij een rol spelen [Older cyclists. Crashes involving older cyclists and contributory factors]. R-2020-22A [Summary in English]. SWOV, Den Haag.

[17]. Twisk, D.A.M., Platteel, S. & Lovegrove, G.R. (2017). An experiment on rider stability while mounting: Comparing middle-aged and elderly cyclists on pedelecs and conventional bicycles. In: Accident Analysis & Prevention, vol. 105, p. 109-116.

[18]. Davidse, R.J., Duijvenvoorde, K. van, Boele, M., Doumen, M.J.A., et al. (2014). Fietsongevallen van 50-plussers: karakteristieken en ongevalsscenario's van enkelvoudige ongevallen en botsingen met overig langzaam verkeer. Een dieptestudie naar fietsongevallen met 50-plussers in de regio’s Hollands Midden en Haaglanden. [Bicycle crashes of people aged 50 and over: characteristics, crash scenarios and possible interventions; An in-depth study]. R-2014-3A [Summary in English]. SWOV, Den Haag.

[19]. Beck, B., Stevenson, M.R., Cameron, P., Oxley, J., et al. (2019). Crash characteristics of on-road single-bicycle crashes: an under-recognised problem. In: Injury prevention, vol. ePub.

[20]. Vingaard Olesen, A., Kidholm Osmann Madsen, T., Hels, T., Hosseinpour, M., et al. (2021). Single-bicycle crashes: An in-depth analysis of self-reported crashes and estimation of attributable hospital cost. In: Accident Analysis & Prevention, vol. 161, p. 106353.

[21]. KiM (2020). Fietsfeiten: nieuwe inzichten. KiM-20-A17. Kennisinstituut voor Mobiliteitsbeleid (KiM), The Hague.

[22]. NTFU (2015). Veiligheidshandboek Wielersport. Nederlandse Toer Fiets Unie, Veenendaal.

[23]. Twisk, D., Stelling, A., Gent, P. van, Groot, J. de, et al. (2021). Speed characteristics of speed pedelecs, pedelecs and conventional bicycles in naturalistic urban and rural traffic conditions. In: Accident Analysis & Prevention, vol. 150, p. 105940.

[24]. Jacobsen, P.L. (2003). Safety in numbers: More walkers and bicyclists, safer walking and bicycling. In: Injury Prevention, vol. 9, nr. 3, p. 205-209.

[25]. Elvik, R. & Goel, R. (2019). Safety-in-numbers: An updated meta-analysis of estimates. In: Accident Analysis and Prevention, vol. 129, p. 136-147.

[26]. Elvik, R. & Bjørnskau, T. (2017). Safety-in-numbers: A systematic review and meta-analysis of evidence. In: Safety Science, vol. 92, p. 274-282.

[27]. Wegman, F., Zhang, F. & Dijkstra, A. (2012). How to make more cycling good for road safety? In: Accident Analysis & Prevention, vol. 44, nr. 1, p. 19-29.

[28]. Elvik, R. (2009). The non-linearity of risk and the promotion of environmentally sustainable transport. In: Accident Analysis & Prevention, vol. 41, nr. 4, p. 849-855.

[29]. Schepers, J.P. & Heinen, E. (2013). How does a modal shift from short car trips to cycling affect road safety? In: Accident Analysis & Prevention, vol. 50, p. 1118-1127.

[30]. Schepers, P. (2012). Does more cycling also reduce the risk of single-bicycle crashes? In: Injury Prevention, vol. 18, nr. 4, p. 240-245.

[31]. Stipdonk, H. & Reurings, M. (2012). The effect on road safety of a modal shift from car to bicycle. In: Traffic Injury Prevention, vol. 13, nr. 4, p. 412-421.

[32]. Waard, D. de, Houwing, S., Lewis-Evans, B., Twisk, D., et al. (2016). Bicycling under the influence of alcohol. In: Transportation Research Part F: Traffic Psychology and Behaviour, vol. 41, p. 302-308.

[33]. Houwing, S., Twisk, D. & Waard, D. de (2015). Alcoholgebruik van jongeren in het verkeer op stapavonden. R-2015-12. SWOV, Den Haag.

[34]. Meel, E. van der (2013). Red light running by cyclists. Which factors influence the red light running by cyclists? Master Thesis. Delft University of Technology, Delft.

[35]. Schleinitz, K., Petzoldt, T., Kröling, S., Gehlert, T., et al. (2019). (E-)Cyclists running the red light – The influence of bicycle type and infrastructure characteristics on red light violations. In: Accident Analysis & Prevention, vol. 122, p. 99-107.

[36]. Kint, S.T. van der & Mons, C. (2021). Interpolis Barometer 2021. Vragenlijststudie mobiel telefoongebruik in het verkeer [Interpolis Barometer 2021. Questionnaire study mobile phone use in traffic]. R-2021-29 [Summary in English]. SWOV, Den Haag.

[37]. Stelling-Konczak, A., Wee, G.P. van, Commandeur, J.J.F. & Hagenzieker, M. (2017). Mobile phone conversations, listening to music and quiet (electric) cars: Are traffic sounds important for safe cycling? In: Accident Analysis & Prevention, vol. 106, p. 10-22.

[38]. Dingus, T.A., Owens, J.M., Guo, F., Fang, Y., et al. (2019). The prevalence of and crash risk associated with primarily cognitive secondary tasks. In: Safety Science, vol. 119, p. 98-105.

[39]. Timmermans, E., Prey, A. & Laurens, J. (2022). Lichtvoering fietsers 2021/2022. Rijkswaterstaat Dienst Water Verkeer en Leefomgeving.

[40]. BOVAG-RAI (2022). Mobiliteit in Cijfers Tweewielers 2022-2023. Stichting BOVAG-RAI Mobiliteit, Amsterdam.

[41]. Rijksoverheid (2022). Wat zijn de regels voor fietsverlichting en reflectie op een fiets? Ministerie van Verkeer en Waterstaat. Accessed on 22-12-2022 at www.rijksoverheid.nl/onderwerpen/fiets/vraag-en-antwoord/wat-zijn-de-regels-voor-fietsverlichting-en-reflectie-op-een-fiets.

[42]. Westerhuis, F., Brookhuis, K. & Waard, D. de (2021). Kennis over fietsverlichting anno 2021. Rijksuniversiteit Groningen, Groningen.

[43]. Kuiken, M. & Stoop, J. (2012). Verbetering van fietsverlichting. Verkenning van beleidsmogelijkheden. Ministerie van Infrastructuur en Milieu (IenM), Directoraat-Generaal Rijkswaterstaat, Dienst Verkeer en Scheepvaart DVS, Delft.

[44]. Overheid.nl (2022). Wegenverkeerswet 1994. Artikel 185. Accessed on 22-12-2022 at wetten.overheid.nl/BWBR0006622/2022-05-20#HoofdstukXII.

[45]. Wikepedia (2022). Artikel 185 Wegenverkeerswet. Accessed on 22-12-2022 at nl.wikipedia.org/wiki/Artikel_185_Wegenverkeerswet.

[46]. Grapperhaus, F.B.J. (2020). Laatste stand van zaken in de uitvoering van eerder gedane toezeggingen op het terrein van de verkeershandhaving. Brief regering 29398-880. Ministerie van Justitie en Veiligheid. Accessed on 22-12-2022 at www.tweedekamer.nl/kamerstukken/brieven_regering/detail?id=2020Z20715&did=2020D44458.

[47]. ANWB (2022). Aanrijding met voetganger of fietser. ANWB. Accessed on 22-12-2022 at www.anwb.nl/juridisch-advies/aanrijding-en-dan/aansprakelijkheid/voetganger-of-fietser.

[48]. Wijlhuizen, G.J. & Gent, P. van (2014). Race- en toerfietsen: mogelijkheden voor meer veiligheid. Vragenlijststudie en expertbeoordeling [Racing and touring bicycles: opportunities for greater safety. Questionnaire study and expert assessment]. R-2014-20A [Summary in English]. SWOV, Den Haag.

[49]. Dubbeldam, R., Baten, C., Buurke, J.H. & Rietman, J.S. (2017). SOFIE, a bicycle that supports older cyclists? In: Accident Analysis & Prevention, vol. 105, p. 117-123.

[50]. TU Delft (2019). Slimme motor in stuur voorkomt vallen met fiets. Technische Universiteit Delft. Accessed on 22-12-2022 at www.tudelft.nl/2019/tu-delft/slimme-motor-in-stuur-voorkomt-vallen-met-fiets.

[51]. Davidse, R., Duijvenvoorde, K. van, Louwerse, R., Boele-Vos, M., et al. (2018). Scootmobielongevallen: Hoe ontstaan ze en hoe zijn ze te voorkomen? R-2018-15. SWOV, Den Haag.

[52]. NVVC (2022). 'Veilig fietsen voor ouderen' wint de Nationale Verkeersveiligheidsprijs! Het nationaal verkeersveiligheidscongres. Accessed on 22-12-2022 at www.nvvc-congres.nl/nvvp.

[53]. Engbers, C., Dubbeldam, R., Buurke, J.H., Kamphuis, N., et al. (2018). A front- and rear-view assistant for older cyclists: evaluations on technical performance, user experience and behaviour. In: International Journal of Human Factors and Ergonomics, vol. 5, nr. 4, p. 257-276.

[54]. Verkeersnet (2016). TNO presenteert nieuwe versie van de intelligente fiets. Accessed on 14-12-2022 at www.verkeersnet.nl/fiets/18859/tno-presenteert-nieuwe-versie-van-de-intelligente-fiets/.

[55]. EC (2019). Regulation (EU) 2019/2144 of the European Parliament and of the Council of 27 November 2019 on type-approval requirements for motor vehicles and their trailers, and systems, components and separate technical units intended for such vehicles, as regards their general safety and the protection of vehicle occupants and vulnerable road users, amending Regulation (EU) 2018/858 of the European Parliament and of the Council and repealing Regulations (EC) No 78/2009, (EC) No 79/2009 and (EC) No 661/2009 of the European Parliament and of the Council and Commission Regulations (EC) No 631/2009, (EU) No 406/2010, (EU) No 672/2010, (EU) No 1003/2010, (EU) No 1005/2010, (EU) No 1008/2010, (EU) No 1009/2010, (EU) No 19/2011, (EU) No 109/2011, (EU) No 458/2011, (EU) No 65/2012, (EU) No 130/2012, (EU) No 347/2012, (EU) No 351/2012, (EU) No 1230/2012 and (EU) 2015/166 (Text with EEA relevance). Official Journal of the European Union. Accessed on 22-12-2022 at eur-lex.europa.eu/eli/reg/2019/2144/oj.

[56]. VVN (2022). Nationaal VVN Verkeersexamen. Veilig Verkeer Nederland. Accessed on 22-12-2022 at examen.vvn.nl/.

[57]. Balk, L., Lindert, C. van & Collard, D. (2020). Doortrappen. Eindrapport vooronderzoek. Mulier Instituut, Utrecht.

[58]. Towner, E., Dowswell, T., Burkes, M., Dickinson, H., et al. (2002). Bicycle helmets - a review of their effectiveness: a critical review of the literature. Road Safety Research Report No. 30. Department for Transport, London.

[59]. Boele, M., Panneman, M., Adriaensens, L., Goldenbeld, C., et al. (2016). Fietshelmcampagne ‘Coole kop, helm op!’ in Zeeland. Evaluatie van de effecten. SWOV/VeiligheidNL, Den Haag/Amsterdam.

[60]. Sølund Ehlers, P. (2022). How the Danish cyclists were convinced to use a bicycle helmet - without a law. In: FERSI Conference. The Hague.

[61]. Olsson, B. (2021). Hjelmrapport: Brug af cykelhjelm 2020. [Summary in English]. Rådet for Sikker Trafik, København Ø.

12 + 8 =
Solve this simple math problem and enter the result. E.g. for 1+3, enter 4.

Would you like to cite this fact sheet?

SWOV publication

This is a publication by SWOV, or that SWOV has contributed to.