Children aged 0-14

Updated

Children are a vulnerable group among road users. They are, after all, still building up skills which will eventually allow them to become safe and independent road users. The role of parents in teaching their children how to behave safely in traffic is very important.  In this fact sheet, children are taken to belong to the age category 0 to 14, unless specified otherwise.

In recent decades, children’s road safety has greatly improved, although the decrease in road deaths seems to have stagnated in the last few years. In comparison to other age groups, children are less often killed in traffic and less often get seriously injured in a road crash. This positive safety trend is mainly caused by the increase of 30km/h zones, the improved occupant safety of cars and more frequent use of child restraint seats. When children do get seriously injured in traffic, they are often walking or cycling. Most fatalities occur among children on bicycles involved in a car crash. Only 0-4-year-olds are most often killed as car occupants. Effective measures to further increase children’s road safety are: speed reduction for motor vehicles; autonomous emergency braking systems in cars; use of adequate means of protection such as bicycle helmets; and gaining a lot of experience as supervised road users at a young age.

How many children are killed or get seriously injured in Dutch traffic?

In 2018, 19 road deaths occurred in the age category 0-14. By contrast: in the years 1996-2000, 65 children were annually killed in traffic. In recent decades, children’s road safety has greatly improved, although the decrease in road deaths seems to have stagnated in the last few years. Figure 1 provides an overview of the number of road deaths among children in the last 22 years.

According to hospital data (LBZ), the share of children among registered seriously injured road users relative to other[i].

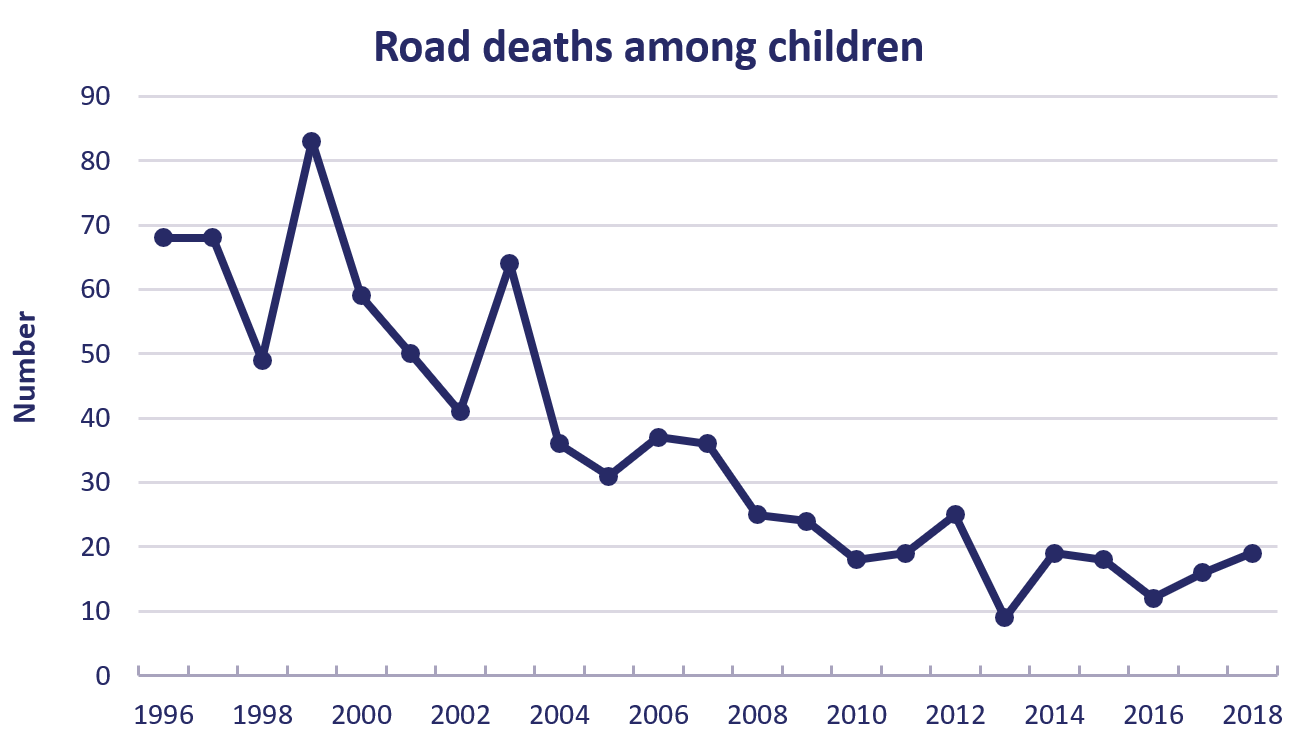
Figure 1. The number of road deaths among children aged 0-14 in the years 1996-2018. Source: CBS .


[i] Since the number of seriously injured road users in 2018 was still unknown at the time of publishing this fact sheet, the figures for 2017 were used.

What risk do children run in Dutch traffic?

Compared to other age groups, children are less often killed on account of a road crash. Relatively speaking, children are also less often seriously injured in traffic. In 2018, children aged 0-14 represented 16% of the Dutch population, while ‘merely’ representing 2.8% of the entire number of road deaths and, in 2017, an estimated 6% of the number of seriously injured road users.

Traffic risk may be calculated by relating the number of casualties to the amount of kilometres travelled by road users (mobility). Here, it is relevant to distinguish two different groups: children up until primary school leaving age and children at secondary school. The latter travel longer distances to and from school independently. In the years 2012-2017, 1.1 children were killed in traffic per billion kilometres travelled. For children aged 12-14, the fatality rate increases to 1.6 compared to 0.9 for children aged 0-11. In comparison: across all age categories, an average of 3.3 road users were killed per billion kilometres travelled.

Which modes of transport result in most casualties among children?

Most casualties among children occur when they participate in traffic as cyclists or pedestrians. In the years 2008-2017, most road deaths among children occurred in bicycle-car crashes (38 deaths), followed by pedestrian-car crashes (28 deaths) and bicycle-lorry crashes (24 deaths). Child casualties among car occupants also occur relatively often (30 in the years 2008-2017).

In traffic, children aged 0-4 are most frequently killed as car occupants (see Figure 2). In absolute numbers, the major traffic safety problem for children concerns cyclists aged 12-14. At that age, children participate in traffic more frequently and often independently (as cyclists).

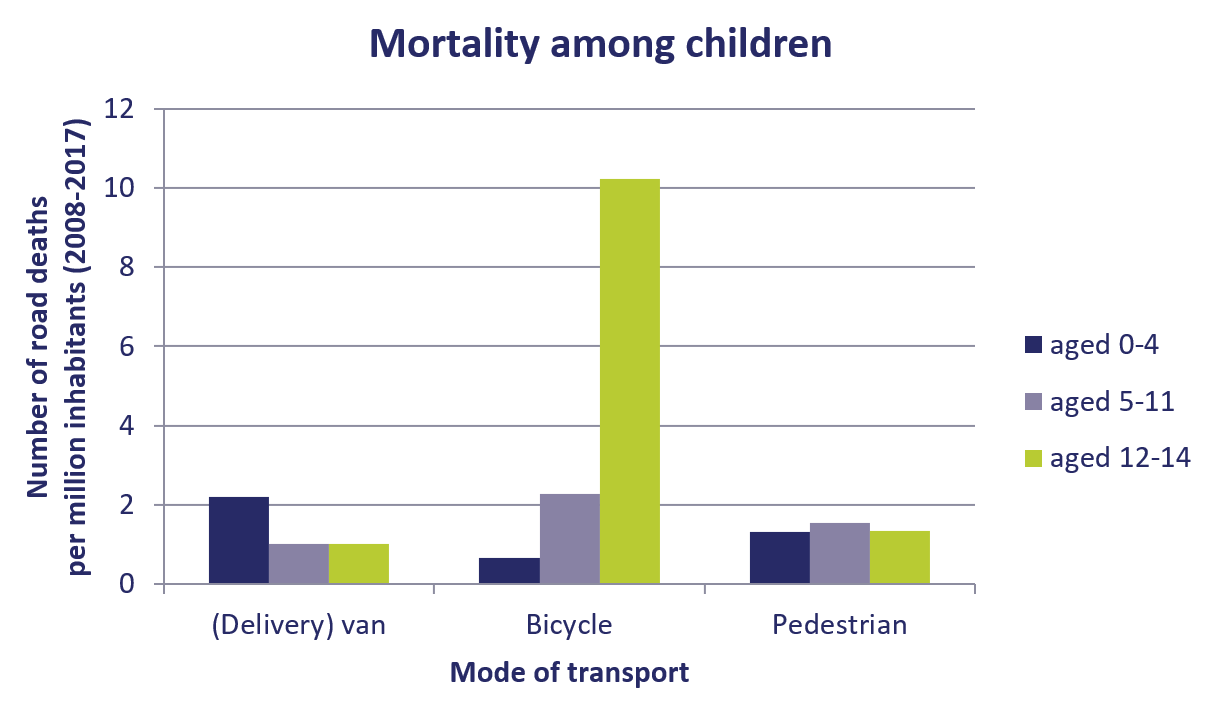
Figure 2. Mortality (the number of road deaths per million inhabitants) among children, by mode of transport (as passenger in a car/delivery van); 2008-2017 averages. Source: Statistics Netherlands (CBS), Ministry of Infrastructure and Water Management (IenW) and Dutch Hospital Data (DHD).

Children were mainly seriously injured in crashes without involvement of motor vehicles: they were either cycling or walking, and no motor vehicles were involved in their falls either (also see SWOV fact sheet Serious road injuries in the Netherlands).

Are there more casualties among young cyclists at the start of the school year?

In the years 2005-2014[i], the number of seriously injured road users among cyclists aged 12 was higher in September than in other months (see Figure 3). A possible explanation is that, at that time, they cycle to their secondary schools for the first time. Initially, they have to get used to a new, often longer route and sometimes to a new bicycle. Among other age groups the increase in September casualties is less high.

Figure 3. Distribution of seriously injured cycling children by age group across the year; 2005-2014 averages. Source: Ministry of Infrastructure and Water Management (IenW) and Dutch Hospital Data (DHD).


[i] This graph presents percentages instead of absolute numbers, since the absolute numbers of seriously injured road users by age group are not reliable enough.

How do children develop and how does this affect road safety?

Children have gained little experience in road user behaviour. They do not know the traffic rules yet, and still have to learn how to behave in traffic. In addition, safe participation in traffic requires correct perception of speed and distance, and specific motor skills (e.g. road crossing: adapting walking speed to the speed and distance of crossing traffic). Small children are still fully engaged in learning the rules and mastering the skills which will allow them, later in life, to participate in traffic independently. When leaving primary school, their experience is mostly still limited [1]. An overview of what children are roughly able to do at a certain age is presented below. These are guidelines; every child develops skills at its own pace. Differences in gender and character, such as impulse control, may also affect road user behaviour [2].

Aged 0-4

Very young children (up to age 4) do not yet have the motor skills, sensory and cognitive skills required to participate in traffic independently [3]. Their behaviour is unpredictable and, up to age 4, a child is unable to recognise danger. Therefore, up to this age, children should not be allowed to participate in traffic independently [3].

Aged 4-7

Up to age 7, children view the world from an egocentric perspective [1]. They have trouble seeing things from someone else’s point of view. This implies that, when a child sees a car, it automatically assumes that the car/driver also sees him or her. The child is unable to take account of the dangers that are not immediately visible (e.g. when it cannot see other traffic on account of a parked car) [4]. At this age, relatively simple motor skills such as mounting or dismounting a bicycle are still hard to master [5].

Moreover, cause-and-effect does not exist for children up to age 7. They do not understand that their actions may have consequences [1]. Thus, they may be inclined to play ball games in the street, unaware of the consequences of and for oncoming traffic. Children are also less sensitive to visual changes in the size of objects (on the basis of which travel direction and speed of the objects may be estimated). An approaching car is thus less easily discernible to them. Particularly, speeds higher than 30 km/h prevent children, even up to age 11, to see less easily than adults whether a car is approaching [6]. A different study shows that children aged 5 or 6 are less able to scan relevant information in their environment than adults, which might reduce their ability to make safe crossing decisions [7].

Although, at this age, children already quite often find themselves in complex traffic situations, for example when walking or cycling to school, it is important that they are still accompanied by adults.

Aged 7-10

From approximately the age of 7 onwards, children are better able to see things from someone else’s perspective [1]. From that age onwards, children do not base their decisions on the prevailing traffic rules only. They are better able to assess driver intentions on the basis of the driver’s behaviour [8]. Abstract concepts such as time and speed are, however, still hard for them. Children in this age group also have trouble, for example, estimating the speed at which a car is approaching. Complex situations are still very difficult for them and they are often unable to assess such situations. For this age group, also the more complex motor skills, such as keeping one’s balance on a bicycle while indicating direction by hand signals, are still hard [5].

Aged 10-14

From the age of 10, children are able to think in more abstract terms. They are more able to recognise and avoid risks. They are now also more able to understand complex traffic rules. Despite this progress, research shows that, when leaving primary school, cycling children still struggle with certain complex traffic situations [9]. Moreover, in adolescence, children display more hazardous behaviour than adults do. This appears not to be caused, as is often thought, by worse risk perception or overestimation of their own abilities. They even judge their own vulnerability to exceed that of others and generally overestimate well-known risks (such as contracting HIV and lung cancer). Yet, the estimated benefits of certain behaviour, together with their poor impulse control, make them generally take more risks than other age groups [10].

What are important causes of crashes involving children?

In the years 2008-2017, most road deaths among children occurred when they crashed with a car while cycling (21%) or walking (16%) and when they crashed with a lorry while cycling (14%). Also see the question Which modes of transport result in most casualties among children? It is, however, unknown what and who caused these crashes. When children get seriously injured in crashes, often no motor vehicles are involved (see SWOV fact sheet Serious road injuries in the Netherlands).

Less serious crashes which did result in visits to an emergency room, mostly proved to be crashes without involvement of any other road user [11]. 86% of the children aged 0-12 that visited an emergency room after a crash were involved in bicycle crashes. Among 0-3-year-olds, the most frequent cause of the crash was entrapment between spokes (53% of the casualties). Among 4-12-year-olds, the most frequent cause was a fall from a bicycle (38%), although entrapment between spokes also occurred (25%).

How best to transport children safely?

Car

In a car, children up to a height of 135 cm must be seated in child restraint seats. The use of these seats and boosters in cars reduces the risk of serious injury. After all, standard seat belts have not been designed for young children and do not offer the protection they offer adults [12]. Yet, several (international) studies show that child protection systems are often used inappropriately [13] [14] [15], for example because the seat belt has been fitted incorrectly or the child restraint seat has been installed incorrectly. Also see the answer to the question How often are children not properly restrained in cars and how dangerous is this?.

Bicycle

When transporting children on the back of a bicycle (in a bicycle seat), it is important to have spoke protectors to prevent the child’s feet from getting caught in the spokes [11] [16]. A bicycle helmet may also increase the safety of transport by bike. SWOV estimates the annual maximum reductions of the number of cycling casualties among children up to the age of 12 to be 5 road deaths and about 200 serious injuries, if all children aged 12 or younger were to wear bicycle helmets at all times [17]. Also see SWOV fact sheet Bicycle helmets.

In addition to front- or rear-mounted bicycle seats, (electric) cargo bikes or ‘child carts’ (such as the Dutch Stints) are also used for transporting children. No research into the traffic risk of different types of bicycles has been done.

By car or by bike?

It is hard to ascertain how children may best be transported (e.g. when taking them to school): by car, by bike, or on foot. Taking the mode of transport on its own merits, it is much safer to transport children by car, since they are then properly protected against crashes. Yet, children that walk or cycle to school, learn and practise skills that are needed to become safe road users (also see the answer to the question How does traffic education and practice affect children’s road safety?). If a lot of parents take their children to school by car, the children will not acquire these skills, while creating an unsafe environment for children that do walk or cycle to school. Infrastructural measures may improve safety by reducing the maximum speed in places where walking and cycling children abound. These different types of road users may also be separated, e.g. by the strategic planning of parking areas.

How often are children not properly restrained in cars and how dangerous is this?

In the Netherlands, the use of child restraint seats in cars is mandatory for children up to 135 cm in height. In 2018, research by VeiligheidNL (SafetyNL) among 470 children aged 0-8 showed that 83% of the children were not appropriately transported by car: meaning they were not correctly restrained in a child restraint seat or even that these seats were not at all used for children smaller than 135 cm [13]. Of the seats used, 7% did not have the correct size (too big or too small) and 49% had not been correctly installed. 59% of the children were not properly restrained in their seats.

Unsecure fastening of child restraint seats may reduce their effectiveness and thus lead to an increased injury risk in crashes [15] [18] [19] [20]. Belgian research showed, for instance, that for a third of the children transported in a safety system, the effectiveness of the system was seriously diminished or even no longer existent [15].

How does traffic education and practice affect children’s road safety?

Traffic education

Not much is known about the effects of formal traffic education. An effect on crash risk has not yet been proved. Some evaluations show that traffic education may affect (self-reported) attitude or behaviour, provided the programme has been well designed. More about this in SWOV fact sheet Traffic education.

Parents and caregivers have an important role in sharing knowledge and teaching their children skills to become safe road users [21]. This does usually not happen in the form of a programme or project as happens at school, but more informally, in daily life. Children learn by example. Frequent practising is important to learn how to behave safely.

Practising in traffic

For all age groups, practising is important to acquire the skills needed to become safe road users. It is also important to adapt the specific motor skills and cognitive skills that are practised to age and experience [5] [22]. Training and education may then be used to expedite the natural process of certain developments. Children learn by observing the behaviour of others, which means parents should set a good example. Learning by experience is the most effective way to create risk awareness [23]. Young children are often only able to apply skills in situations in which the skill was practised. For them, to cross the road at a location different from the practice spot, for instance, is therefore difficult. That is why it is essential to practise frequently at a lot of different traffic locations [21].

More about the development of children as road users and the parents’ role in this process is to be found in SWOV report The role of parents in the informal learning process of children aged 4-12 [Summary in English].

Are children driven to school more and more often?

The figures do not unequivocally show that children are driven to school more and more often. As shown in Table 1, the number of children driven to school did not change much in the years 2003-2014, with the exception of a peak in the study by Metz & De Haan [24]. The latest study was done by XTNT in 2014 among 1,847 households (2,739 children) [25]. This study shows that 12% of the children are always taken to school by car. When looking at the average cycling distance in kilometres per child per day for children aged 0-12, there have not been any large differences in the last eight years (Figure 4).

Study

Independently


Accompanied


Other


On foot

By bike


On foot

By bike

By car


Van der Houwen, Goossen & Veling (2003) [26]

15%

21%


18%

28%

15%


3%

Hoekstra, Mesken & Vlakveld (2010) [27]

15%

20%


16%

27%

12%


10%

Hoekstra & Mesken (2010) [28]

12%

20%


23%

25%

15%


5%

Metz & De Haan (2013) [24]

14%

17%


16%

20%

30%


3%

XTNT (2014)* [25]

8%

16%


13%

22%

12%


1%

Table 1. Percentages of children that travel to school independently or are accompanied to school
*the percentage of children that always travel to school in this way (ranging from never or sometimes to always).

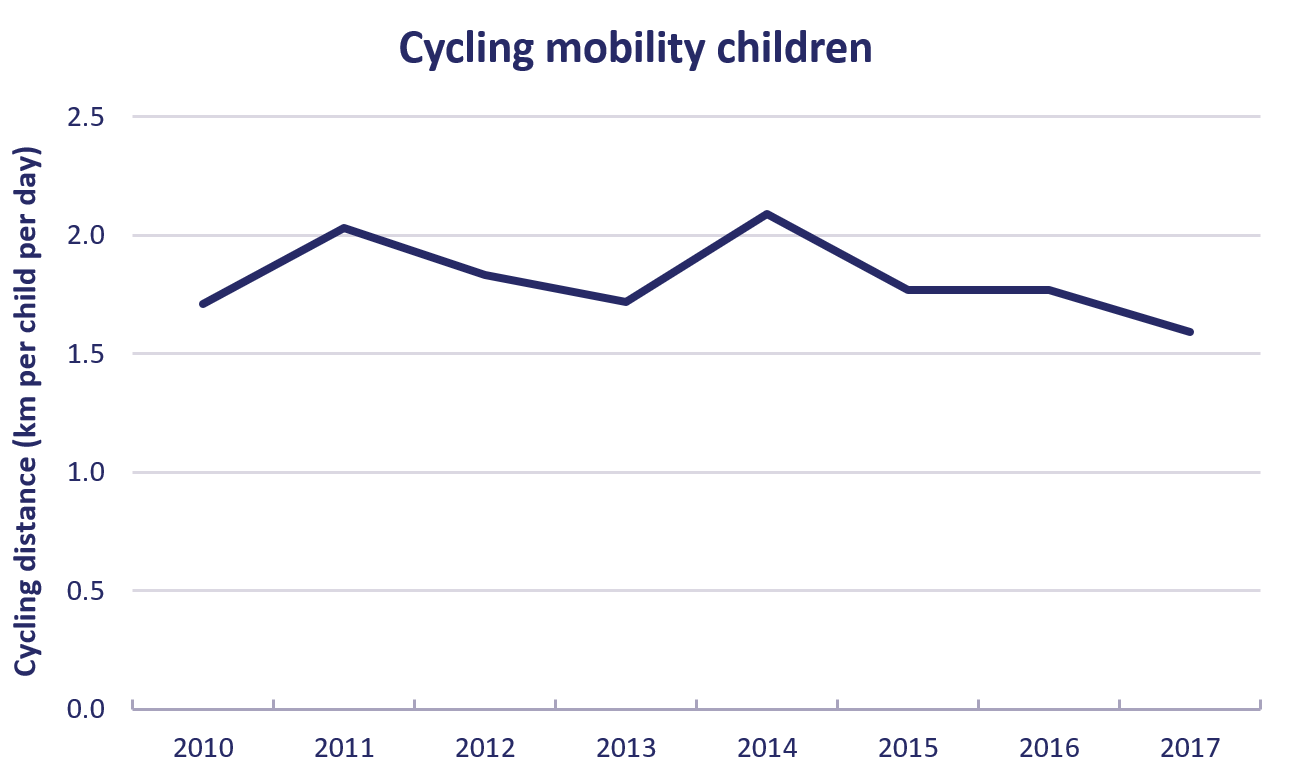
Figure 4. The number of bicycle kilometres per day, per child, for children aged 0-12. Source: CBS StatLine, 2018.

What measures and factors have contributed to the improvement of children’s road safety?

Several measures have contributed to the improvement of road safety in general and thus to children’s road safety. These are combined measures in the field of infrastructure, vehicles, means of protection and education.

Infrastructure

Examples of infrastructural measures are the increase of the number of 30km/h zones; the more frequent physical separation of fast and slow traffic; more roundabouts; and the redirection of mopeds to the carriageway. These aspects of the Dutch programme Sustainable Safety are relevant to all cyclists and pedestrians and, thus, to all walking and cycling children [29] [30] [31] [32].

Vehicle safety

Cars have become safer for their occupants and, thus, for child passengers. In addition, car fronts have become safer, so that collisions with pedestrians and cyclists have less serious outcomes. At the end of 2003, EU regulations took effect, in particular concerning the protection of pedestrians. In the EU, view-enhancement systems have become mandatory for lorries; these include blind spot mirrors and cameras. These kinds of provisions reduce the number of crashes involving right-turning lorries and cyclists. For more information see SWOV fact sheet Safe passenger cars.  

Protection measures

The protection of children in cars has been improved since the use of (ever improving) child restraint seats became customary. In the Netherlands, the use of EU approved child restraint seats in cars has become mandatory for children up to 135 cm in height. In 2013, the new EU directive called ‘i-Size’ took effect (ECE-R129). This directive lays down that every type of child restraint seat must have passed an impact test prior to approval; that child restraint seats must be categorised according to body height; and that children up to 15 months old must be transported in rear-facing seats. Since 2004, bicycle child seats have also been subject to European safety standards.

Education

In the field of traffic education, a lot of initiatives have been taken, not only in formal school education, but also in informal education by parents. Parents play an important role in sharing knowledge and teaching skills that allow their children to become safe road users [21]. Although education is important to adequately equip children for traffic participation, not much is known about its crash risk effects (also see SWOV fact sheet Traffic education and the question How does traffic education and practice affect children’s road safety?).

What measures may be taken to increase children’s road safety?

Infrastructure

Impact velocity greatly affects injury severity. That is why speed reduction at locations where and times of day when children and motorised traffic meet (in residential areas, near schools and pedestrian/bicycle crossings) is a priority. Optimising and expanding 30km/h zones, and making pedestrian/bicycle crossings safer are also important (also see SWOV fact sheets Pedestrian safety en 30km/h zones).

Vehicle safety

The use of Intelligent Speed Assistance (ISA) as a speed limiter may ensure speed reduction in certain areas where and at certain times of day when a lot of children participate in traffic. Autonomous Emergency Braking (AEB) systems with cyclist and pedestrian recognition may further improve children’s road safety [33].

Protection measures

Stimulating parents and caregivers to use child restraint seats correctly would improve road safety for children in cars or on bicycles. In addition, they could be stimulated to arrange for better spoke protectors to prevent injuries for bicycle passengers [16]. Also see the questions How often are children not properly restrained in cars and how dangerous is this? and How best to transport children safely?

Furthermore, the use of bicycle helmets by children could be stimulated (see SWOV fact sheet Bicycle helmets). Appropriate public information campaigns, targeting parents and highlighting how they act as role models could increase the use of bicycle helmets. If all children in the Netherlands wore bicycle helmets up to age 12, this could, according to a SWOV calculation, lead to an annual reduction of five road deaths and two hundred serious road injuries [17].

Education

It is important to keep informing parents about acting as role models in traffic and to further motivate them to affect their children’s behaviour in traffic in a positive way [21] [34]. This involves that parents have proper knowledge and skills to show their children how to behave appropriately [20] [34] [35].

Apart from the development of certain (cognitive) skills, children should also gain experience. The younger they start cycling, the better their cycling skills will be at a later age [5]. Cycling skills are also linked to general motor skills [36].

Publications and sources

Below you will find the list of references that are used in this fact sheet. All sources used can be consulted or retrieved via our Library portal. Here you can also find more literature on this subject.

[1]. Schieber, R.A. & Thompson, N.J. (1996). Developmental risk factors for childhood pedestrian injuries. In: Injury prevention, vol. 2, nr. 3, p. 228-236.

[2]. Barton, B.K. & Schwebel, D.C. (2007). The roles of age , gender , inhibitory control, and parental supervision in children's pedestrian safety. In: Journal of Pediatric Psychology, vol. 32, nr. 5, p. 517-519.

[3]. Vissers, J.A.M.M., Nägele, R.C., Kooistra, A.B., Betuw, A.J.M. van, et al. (2005). Leerdoelendocument Permanente Verkeerseducatie. TT04-056. Traffic Test, Veenendaal.

[4]. Demetre, J.D. (1997). Applying developmental psychology to children's road safety: Problems and prospects. In: Journal of Applied Developmental Psychology, vol. 18, nr. 2, p. 263-270.

[5]. Zeuwts, L., Vansteenkiste, P., Ducheyne, F., Greet, C., et al. (2016). Development of cycling skills in 7- to 12-year-old children. In: Traffic Injury Prevention, vol. 17, nr. 7, p. 736-742.

[6]. Wann, J.P., Pulter, D.R., Purcell, C. (2011). Reduced sensitivity to visual looming inflates the risk posed by speeding vehicles when children try to cross the road. In: Psychological Science, vol. 22, nr. 4.

[7]. Biassoni, F., Bina, M., Confalonieri, F. & Ciceri, R. (2018). Visual exploration of pedestrian crossings by adults and children: Comparison of strategies. In: Transportation Research Part F: Traffic Psychology and Behaviour, vol. 56, p. 227-235.

[8]. Foot, H.C., Thomson, J.A., Tolmie, A.K., Whelan, K.M., et al. (2006). Children's understanding of drivers' intentions. In: British Journal of Developmental Psychology, vol. 24, p. 20.

[9]. Twisk, D., Wesseling, S., Vlakveld, W., Vissers, J., et al. (2018). Higher-order cycling skills among 11- to 13-year-old cyclists and relationships with cycling experience, risky behavior, crashes and self-assessed skill. In: Journal of Safety Research, vol. 67, p. 137-143.

[10]. Reyna, V.F. & Farley, F. (2006). Risk and rationality in adolescent decision making: implications of theory, practice en public policy. In: Psychological Science in the public interest, vol. 7, nr. 1, p. 50.

[11]. VeiligheidNL (2017). Letsels bij kinderen en jeugd 0-18 jaar 2015. VeiligheidNL, Amsterdam.

[12]. Brolin, K., Stockman, I., Andersson, M., Bohman, K., et al. (2015). Safety of children in cars: A review of biomechanical aspects and human body models. In: IATSS Research, vol. 38, nr. 2, p. 92-102.

[13]. Cornelissen, M., Kemler, E. & Hermans, M. (2018). Veilig vervoer van kinderen in de auto. Onderzoek bij kinderen van 0 t/m 8 jaar. VeiligheidNL, Amsterdam.

[14]. Bachman, S.L., Salzman, G.A., Burke, R.V., Arbogast, H., et al. (2016). Observed child restraint misuse in a large, urban community: Results from three years of inspection events. In: Journal of Safety Research, vol. 56, p. 17-22.

[15]. Schoeters, A. & Lequeux, Q. (2018). Klikken we onze kinderen wel veilig vast? Resultaten van de nationale Vias-gedragsmeting over het gebruik van kinderbeveiligingssystemen 2017. Vias institute –Kenniscentrum Verkeersveiligheid, Brussel.

[16]. Kramer, W.L.M. & Haaring, G. (2011). Spaakverwondingen bij kinderen: benadruk preventie. In: Nederlands Tijdschrift voor Geneeskunde, vol. 155, A3736, 4 p.

[17]. Weijermars, W.A.M., Boele-Vos, M.J., Stipdonk, H.L. & Commandeur, J.J.F. (2019). Mogelijke slachtofferreductie door de fietshelm. R-2019-2. SWOV, Den Haag.

[18]. Elliott, M.R., Kallan, M.J., Durbin, D.R. & Winston, F.K. (2006). Effectiveness of child safety seats vs seat belts in reducing risk for death in children in passenger vehicle crashes. In: Archives of Pediatrics & Adolescent Medicine, vol. 160, nr. 6, p. 617-621.

[19]. Kapoor, T., Altenhof, W., Snowdon, A., Howard, A., et al. (2011). A numerical investigation into the effect of CRS misuse on the injury potential of children in frontal and side impact crashes. In: Accident Analysis & Prevention, vol. 43, nr. 4, p. 1438-1450.

[20]. Ma, X., Layde, P. & Zhu, S. (2012). Association between child restraint systems use and injury in motor vehicle crashes. In: Academic Emergency Medicine, vol. 19, nr. 8, p. 916-923.

[21]. Hoekstra, A.T.G. & Twisk, D.A.M. (2010). De rol van ouders in het informele leerproces van kinderen van 4 tot 12 jaar. Een eerste verkenning [The role of parents in the informal learning process of children in the age group 4 to 12 years old. A first investigation]. R-2010-19 [Summary in English]. SWOV, Leidschendam.

[22]. Assailly, J.P. (2017). Road safety education: what works? In: Patient Education and Counseling, vol. 100, suppl. 1, p. S24-S29.

[23]. DaCoTa (2012). Children in road traffic; Deliverable 4.8c of Road Safety Data, Collection, Transfer and Analysis DaCoTa. European Commission, Brussels.

[24]. Metz, F. & Haan, J. de (2013). Dashboard duurzame en slimme mobiliteit: Schoolmobiliteit. KpVV-CROW, Utrecht.

[25]. Lankhuijzen, R. & Lax, J. (2014). Samen veilig naar school: hoe ouders aankijken tegen de school-thuisroute. XTNT Experts in Traffic and Transport. In opdracht van Veilig Verkeer Nederland, Utrecht.

[26]. Houwen, K. van der, Goossen, J. & Veling, I. (2003). Reisgedrag kinderen basisschool: eindrapport. TT 02-95. Traffic Test, In opdracht van het Fietsberaad, Veenendaal.

[27]. Hoekstra, A.T.G., Mesken, J. & Vlakveld, W. (2010). Zelfstandig of begeleid naar school: beleving van verkeersonveiligheid door ouders van basisschoolleerlingen. Een vragenlijststudie [Alone or accompanied to school: perceived safety in traffic by parents of primary school pupils. A survey study]. R-2010-7 [Summary in English]. SWOV, Leidschendam.

[28]. Hoekstra, A.T.G. & Mesken, J. (2010). De rol van ouders bij informele verkeerseducatie; Vragenlijststudie naar kennis, behoeften en motieven van ouders [The role of parents in informal traffic education; Questionnaire study of parents' knowledge, needs and motivation]. R-2010-31 [Summary in English]. SWOV, Leidschendam.

[29]. Wegman, F. & Aarts, L. (2006). Advancing Sustainable Safety; National Road Safety Outlook for 2005-2020. SWOV, Leidschendam.

[30]. Weijermars, W.A.M. & Schagen, I.N.L.G., van (2009). Tien jaar Duurzaam Veilig. Verkeersveiligheidsbalans 1998-2007 [Ten years of Sustainable Safety. Road safety assessment 1998-2007]. R-2009-14 [Summary in English]. SWOV, Leidschendam.

[31]. Schepers, P., Twisk, D., Fishman, E., Fyhrid, A., et al. (2017). The Dutch road to a high level of cycling safety. In: Safety Science, vol. 92, p. 264-273.

[32]. Twisk, D.A.M., Davidse, R.J. & Schepers, P. (2017). Challenges in reducing bicycle casualties with high volume cycle use: Lessons from the Netherlands. In: Gerike, E. & Parking, J. (red.), Cycling futures. From Research into Practice. Ashgate Publishing Limited, Farnham, England, p. 137-154.

[33]. Aarts, L., Eenink, R. & Weijermars, W. (2014). Opschakelen naar meer verkeersveiligheid; naar maximale verkeersveiligheid voor en door iedereen. R-2014-37. SWOV, Den Haag.

[34]. Pol, B., Veldkamp, C. & Baalbergen, J. (2017). De betrokkenheid van ouders/opvoeders bij verkeersveiligheid verhogen: interventierichtingen. Tabula Rasa, Den Haag.

[35]. Muir, C., O'Hern, S., Oxley, J., Devlin, A., et al. (2017). Parental role in children's road safety experiences. In: Transportation Research Part F, vol. 46, p. 195-204.

[36]. Zeuwts, L., Ducheyne, F., Vansteenkiste, P., D'Hondt, E., et al. (2014). Associations between cycling skills, general motor competence and body mass index in 9-year-old children. In: Ergonomics, vol. 58, nr. 1, p. 12.

1 + 1 =
Solve this simple math problem and enter the result. E.g. for 1+3, enter 4.

Would you like to cite this fact sheet?

SWOV publication

This is a publication by SWOV, or that SWOV has contributed to.