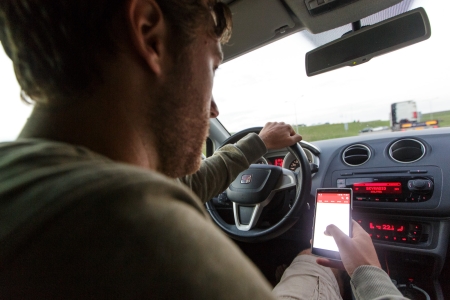
A large number of drivers appear to be engaged in activities which are potentially distracting. Naturalistic Driving research[i] in the US shows that drivers spend approximately 50% of their driving time on distracting activities [14] [15] (also see Table 2, third column ‘Prevalence’ in the question How dangerous is it when drivers are distracted in traffic?). In this study, the most frequent distracting activity proved to be talking to passengers: in approximately 15% of the entire driving time. About 6% to 9% of the entire driving time was spent on mobile phone use [14] [15] [16]. Dutch Naturalistic Driving research shows that drivers use their mobile phones in approximately 9% of the entire driving time [17]. Drivers also like to listen to music; well over 90% of drivers regularly listen to music or to the radio in their cars [18]. Drivers can also be engaged in several distracting activities at once. This happens in 11% of the driving time [15].
A Dutch survey also shows that drivers are often engaged in distracting activities [4] (see Table1). 66% of the drivers in this study indicated having sometimes used their phones while driving. Mobile phones were mainly used for handsfree calls (46%), for reading or sending text messages (42% and 36% respectively) and for setting navigation (44%). A much smaller number of drivers, viz. 20%, reported having sometimes made handheld calls. Prevalence data are also available, derived from observational studies (see [19]). for example). They show the percentage of drivers that were, during one time or another, engaged in distracting activities while driving; the figures are therefore lower than those derived from questionnaire studies which are concerned with the general frequency of distracting activities.
A 2018 observational study showed that drivers made handheld calls three times more often than they operated a smartphone screen[ii] (9% and 3% respectively [19]. Handheld calls were also significantly more frequent than handsfree calls (9% and 2% respectively). This could be because handsfree calls are harder to observe than handheld calls. In addition, 27% of truck drivers and 18% of delivery van drivers proved to use their mobile phones. For car drivers this percentage was 13%.
|
Distraction source |
Distracting activity |
% of drivers engaged in an activity |
|
Taking on the phone
|
Handsfree |
46 |
|
Handheld |
20 |
|
|
Operating a screen |
Reading/sending text messages |
42/36 |
|
Searching for something on phone/checking one’s phone |
22 |
|
|
Taking pictures/recording videos |
19 |
|
|
Setting navigation on phone |
44 |
|
|
Operating phone to play music |
21 |
|
|
Playing games |
8 |
Table: 1. Percentage of drivers that indicate having been engaged in different distracting activities [4].
[i] Naturalistic Driving is a research method used to observe natural driving behaviour of road users by means of devices (cameras and sensors) which inconspicuously register vehicle movements, driver behaviour (such as eye, head and hand movements) and external circumstances.
[ii] Operating a screen was defined as ‘texting or such like, in any case visibly occupied with a phone screen’.